
Year-end Tax Insights!

What Is Normal? The Facts and Figures for Retirement Success
By Brad Stark, MS, CFP
Founder and Chief Compliance Officer
We continue to build diversified portfolios that match the long-term goals of our clients. Risk management is a big part of that decision-making process. Cash flow is another. There will be periods of good times and others that are challenging. Whenever markets trade irrationally, the question becomes, “Is this normal, a new normal, or the start of something that could be either good or bad?”
While history is no guarantee of the future, it can provide good context for a discussion on what is considered “normal.” Mission Wealth associates have been providing financial advice to clients for many decades under all types of market circumstances. During that time, we have identified a handful of investment “requirements” that have helped our clients retire – and stay retired.
Rule #1: The asset allocation that matches the current and long-term goals of our clients is the primary building block of sound financial decisions. Current goals are usually driven by cash-flow needs and long-term goals are driven by the need to outpace inflation. Pre-retirement asset allocations usually call for 70% stock during the “accumulation” phase, and 40%-60% stock during the “distribution” phase (AKA retirement) to provide the highest likelihood of success.
Rule #2: Concentrated positions are inherently dangerous and need to be diversified. Remember, what made you wealthy may not be the same strategy that keeps you wealthy.
Many investors were concentrated in the late 1990s with household names such as Lucent, Global Crossing, WorldCom, Sun Micro, Nokia, Enron, Circuit City, QQQ, Yahoo, AOL, Gateway, Dell, HP, Intel, AMD and every Janus fund (which carried a lot of overlap – something investors became aware of only after the crash). While these holdings were commonplace in the late ’90s, the sobering reminder is that we hardly see these holdings today. Some still exist, others were merged and some went out of business. They have been replaced with a new set, and it’s reasonable to assume that there will be another wave to come of future household names.
Rule #3: Don’t get emotionally attached to holdings.
Rule #4: Individual stocks are on average 2 to 3 times riskier than the market.
Rule #5: When in retirement, target to have no debt. This allows for the most financial flexibility.
Rule #6: Create a portfolio that best provides “known income” to cover “known expenses.”
Rule #7: Don’t get too greedy or too fearful. Take on the appropriate risk level that accomplishes your goals - and no more!
Rule #8: Markets go up and down. Utilize regular re-balancing to trim strength and buy weakness. You won’t buy at the bottom and you won’t sell at the top, but you can live really well between those bookends.
Rule #9: Investing is a marathon, not a sprint.
Rule #10: Market cycles generally pay off well over time, but it takes time.
If you are following the above rules, it is less likely that your emotions will get the best of you. Emotionally driven decisions when it comes to investing are generally poor ones.
Key Takeaways
With this good foundation, what are proper expectations when it comes to investing? Here are some historical data points that we think are telling.
What are “normal market conditions”?
-
- Market declines of 5% are common. Declines of 10% are expected. 15%-20% pull backs are less frequent but are “normal.” For an individual stock, a daily market change of 5-10% is not out of the question and happens all the time.
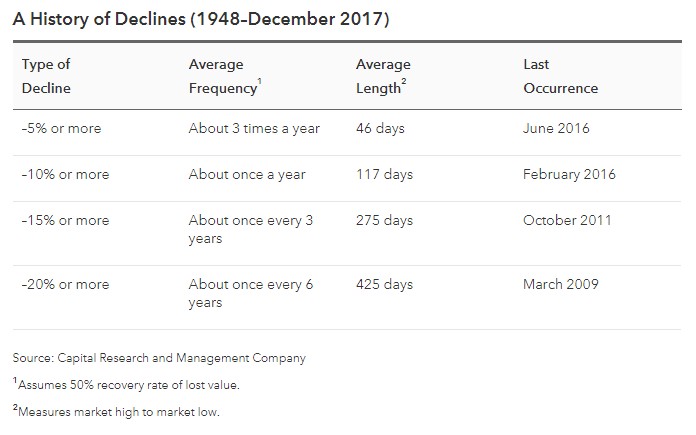
https://www.americanfunds.com/individual/planning/market-fluctuations/past-market-declines.html
-
- The market loses almost 14% on average every year at some point in time. 1
- Takeaway: Don’t have all assets in stocks; own bonds too.
- The market loses almost 14% on average every year at some point in time. 1
-
- The market has ended positive 29 of the past 38 years (76% of the time).1
- Takeaway: Don’t panic when markets sell off. If anything, rebalance into them (that is our process).
- The market has ended positive 29 of the past 38 years (76% of the time).1
-
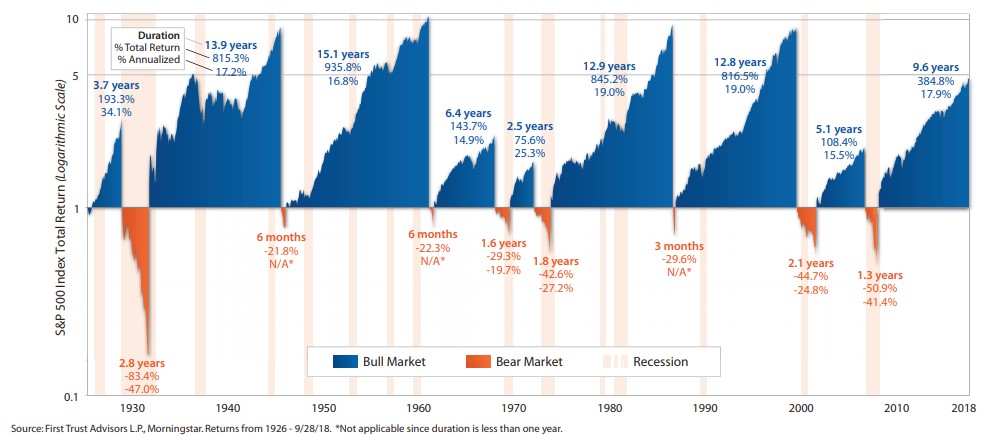
- Over the past 92 years, there have been 15 recessions, 9 bull markets, 8 bears, with “risk” assets performing far better than anything else.2
- Takeaway: Inflation is a risk. One must own risk assets to combat inflation but it is not necessary to have all assets at risk.
- Over the past 92 years, there have been 15 recessions, 9 bull markets, 8 bears, with “risk” assets performing far better than anything else.2
-
- Average bull market run is 9.1 years with a 480% increase. The current run is 9.6 years and 384% prior to the recent retreat.2
- Takeaway: All good runs come to an end. This one is longer than most.
- Average bull market run is 9.1 years with a 480% increase. The current run is 9.6 years and 384% prior to the recent retreat.2
-
- Average bear market is 1.4 years and -41%. 2
- Takeaway: Downturns are typically swift and harsh. Diversification and bond ownership are key to having dry powder to either buy or survive without forced selling in a decline.
- Average bear market is 1.4 years and -41%. 2
-
- During the past 67 years, the market has been positive 53.7% of the trading days and negative 46.3% of the time. It is a virtual coin flip.3
-
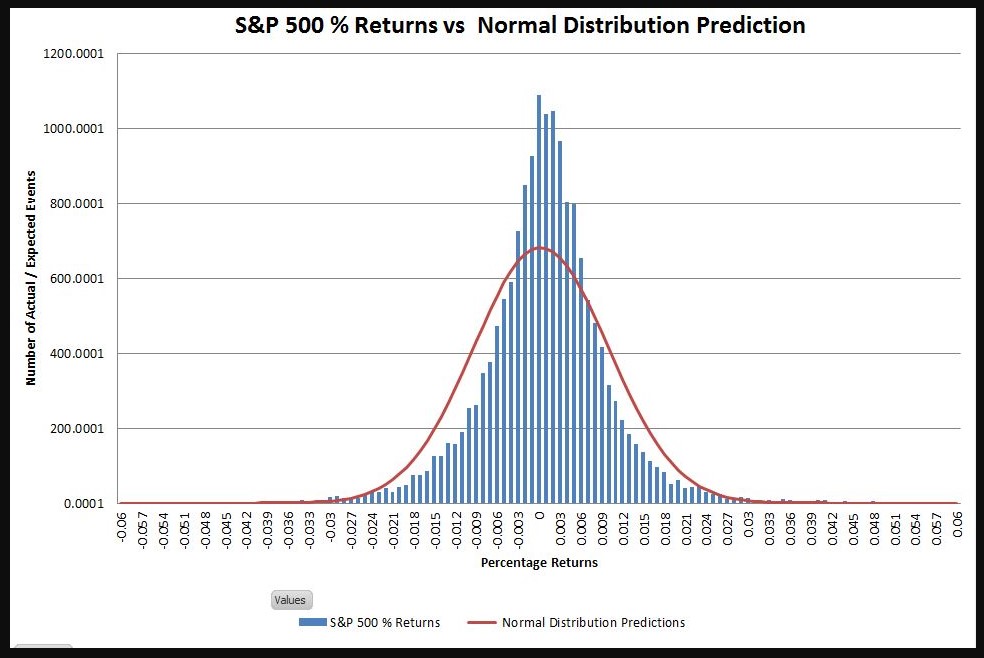
- Since 1950, the average daily returns are clustered between -0.003% and +0.006% with the average daily return slightly positive (under 0.003%). This is why you can end up with almost a 50/50 split of up and down days and have net positive returns over the long haul. 4
- Moves of +/- 0.5% should be expected every day.
- Moves of 1% are normal but usually not frequent.
- Moves of 2% are not common but occur.
- Moves of 3% are rare in totality but do occur.
- Moves of 4% are rare.
- Moves of 6%, while they happen, are extremely rare.
- Since 1950, the average daily returns are clustered between -0.003% and +0.006% with the average daily return slightly positive (under 0.003%). This is why you can end up with almost a 50/50 split of up and down days and have net positive returns over the long haul. 4
-
- A single stock is about 2 to 3 times more volatile than the markets and wider return ranges are expected.5
- Takeaway: If you have more than 5% of your holdings in a single stock, you should consider selling some; 10% very serious discussions, and at a 20% level sell down regardless of taxes.
- A single stock is about 2 to 3 times more volatile than the markets and wider return ranges are expected.5
-
- Stock market returns of +43% to -26% are expected normal ranges of the S&P 500.6
Expected Annual Normal Ranges for Diversified Portfolios. 6
-
-
- 80% Stock: +30 to -20%
- 60% Stock: +27 to -15%
- 40% Stock: +24 to -10%
- 20% Stock: +20 to -6%
- Takeaway: Diversification does not eliminate all the risk and it does not work all the time, but over time, it is a valuable tool to help keep one wealthy and able to withstand major gyrations.
-
-
- Growth stocks are typically riskier than Value. Not recently, but over the long haul, Value stocks have outperformed Growth with significantly less risk.
- Takeaway: Value holdings typically provide higher levels of income (generally needed for our retired clients) and more stability over time.
- Growth stocks are typically riskier than Value. Not recently, but over the long haul, Value stocks have outperformed Growth with significantly less risk.
-
- 55% of the world stock market values are in the US with 45% outside the country (14% Europe ex-UK, 11% Emerging Markets, 8% Japan, 5% UK, 4% Pacific, 3% Canada).1
- Takeaway: The majority of the global population resides in emerging growth countries. The US, Europe and Japan are “mature” economies while most are in a developmental stage. Having exposure to world stocks is important for future growth potential.
- 55% of the world stock market values are in the US with 45% outside the country (14% Europe ex-UK, 11% Emerging Markets, 8% Japan, 5% UK, 4% Pacific, 3% Canada).1
-
- Forward PE Ratios at the beginning of booms and busts 1 (The price-earnings ratio is a metric used for valuing a company / index as it compares the current share price to its earnings). The lower the number, the “cheaper” the valuation:
- 13 PE is considered “cheap”
- 16.1 is the average PE over the past 25 years
- 19 PE is considered “expensive” – last time the market traded above 19 was 1998 to 2002
- 12 PE in the early 1990s – right before the tech boom (cheap)
- 24 PE late ‘90s – right before the dotcom bust & 9/11 (expensive)
- 16 PE in 2003 – right before a 108% rally (average value)
- 15 PE in 07/08 – right before the debt / real estate crash (average value)
- 9 PE in 2009 – right before a 300%+ rally (very cheap)
- 14-15 range is the current PE (slightly below average)
- Takeaway: The current environment is not expensive or cheap.
- Forward PE Ratios at the beginning of booms and busts 1 (The price-earnings ratio is a metric used for valuing a company / index as it compares the current share price to its earnings). The lower the number, the “cheaper” the valuation:
- Foreign markets on average trade at significant valuation discounts to the US in relative terms today.1
- Takeaway: Markets outside the US appear to be “cheap” on a relative basis.
How We Can Help
We will continue to build diversified portfolios that match the long-term goals of our clients. Risk management is a big part of that decision-making process. Cash flow is another. There will be periods of good times and others that are challenging. Yet the base fundamentals we have operated from have been successful through many economic environments, and we will continue to match our process to the goal obtainment of our clients.
A final note: Fear, greed and impatience are the three most detrimental factors when it comes to investing. To put that into perspective, take two stocks that everyone has loved over recent years – Amazon and Apple. From a market high of $113 in 1999, Amazon traded below that price for 10 straight years and hit a low of $6 during that run, a 95% loss. An investment in Apple in the late 1980s was the same value 15 years later before the stock hit a hockey stick upward move. Under no circumstances could we see clients hanging on to a stock for 10 to 15 years waiting for it to break out. That is just not what we experience in the real world of dealing with people, emotions, cash flow needs, etc. The reality of our world is to help guide clients into making reasonable decisions which provide the foundation to support themselves, their family and their charitable / legacy intents.
1 JP Morgan Guide to the Markets Q418
2 First Trust / Morningstar 9/28/18 report
3 Crestmont Research 2018 Percentage Positive and Negative Days S&P 500
4 Six Figure Investing
5 Morningstar
6 MWM Historical Asset Class Returns
READ MORE:
Avoid Being an Average Investor
Tuning Out the Noise
Don’t Time the Markets Based on Fear and Greed
1094434 1/19