
This article/video is part of a series that applies psychology to financial planning so we can all make wealthier decisions. As a multi-billion-dollar investment and planning firm, Mission Wealth can give you collective wisdom and real-life examples from thousands of multimillionaires. You can read 2024 Q1 and Q2’s Investor Commentary here.
Joey Khoury is one of Mission Wealth’s Senior Wealth Advisors and an adjunct professor at UCSB who has studied behavioral finance at Cornell and Harvard. Every quarter, Joey and Mission Wealth publish 1-3 psychological topics that are relevant and current to the world around us.
Last quarter, we distilled everything you need to know about markets during presidential elections; this quarter’s theme is dealing with market volatility.
Watch The Full Video on YouTube
First: How Do People Currently Feel About the Markets?
The Consumer Sentiment Index measures how consumers feel about the economy, personal finances, business conditions, and buying conditions.
The current consumer index measures 68. To put that number in context, the index scored 55 at the worst of 2008 and 72 at the worst of the pandemic. People currently feel worse than they did in April 2020, but not as bad as they felt in 2008.
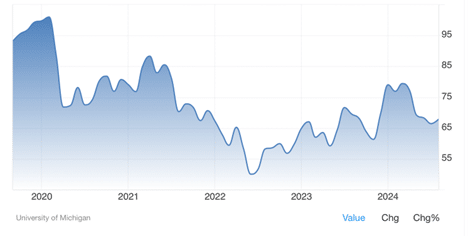
Source: University of Michigan Consumer Sentiment Index. Retrieved 10/17/24.
Rising costs of living, political divisions, market gyrations, the presidential election, and some distrust that the soaring all-time high values on Wall Street may not match the reality on Main Street are at the heart of this sentiment.
As an investor, two central questions come up:
- Are markets riskier now, or are we more fearful today?
- What is a proactive ‘action plan’ for volatile markets?
Normal Volatility
Let’s first understand what is considered average/normal market volatility. This baseline will ground you against fear-inducing headlines during normal market conditions.
The market averages a negative 5% pullback three times a year, a negative 10% pullback once a year, a negative 15% pullback every three years, and a negative 20% pullback every six years.
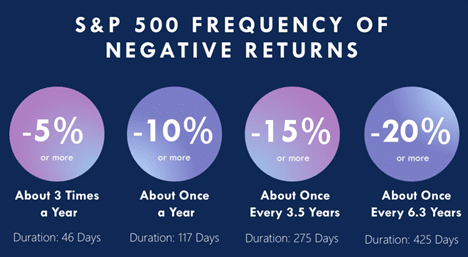
Source: RIMES, Standard & Poor’s 500 Composite Index 1948-2017. Length measured market high to market low.
Despite these normal drawdowns, the S&P 500 has averaged about a 10% annual return for the prior 30 years. However, as any investor knows, this does not mean it earned 10% every year. The emotional difficulty of being invested in the market is that it is completely normal for the S&P 500 to range between approximately +45% to -25% in any calendar year. Sure, the larger positive side will average higher returns over time, but only if you have the wherewithal to stay invested during the low points.
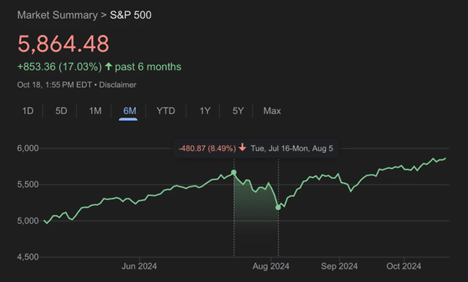
An excellent example of this volatility occurred this quarter, from Tuesday, July 16, 2024, to Monday, August 5, 2024, when the S&P 500 lost 8.5%. This aligns with the above metrics of an average 10% pullback once a year. During that 3-week decline, many investors panicked that the ‘bubble had burst’ and suddenly considered making major allocation decisions despite the 8.5% drop being par for the course.
Creating an Action Plan for Market Volatility
So, what’s your action plan for market volatility? The acronym D.A.R.T.S. (Diversify, Allocate, Rebalance & Range, Tax, Scope) covers the most important concepts and action steps to take when markets move.
Diversify
The D in D.A.R.T.S. stands for Diversify, which is almost an overused word. Most investors know not to put all their eggs in one basket, but diversification also applies to sectors and sub-categories.
Instead of just buying the U.S. Stock Market (such as the S&P 500), talk to your advisor about the pros and cons of including other growth markets, such as international stocks, private equity, real estate, and infrastructure investments. The same can be said for bonds: instead of treasuries (now called ‘T-Bill and Chill’), talk with your advisor about the benefits of capitalizing on elevated interest rates in corporate bonds, municipal tax-free bonds, and private credit.
Lastly, if you have a large portion of your portfolio in one or a few positions, consider three routes:
- A measured divestiture with limited order sales or covered call options.
- Nontaxable protection with costless collars or exchange funds.
- Charitable estate strategies such as donor-advised funds or Charitable trusts.
|
Measured Divestiture |
Limit orders |
Covered Call Options |
|
Protection |
Costless Collar |
Exchange Fund |
|
Charitable |
Donor-Advised Fund (DAF) |
Charitable Trust (CRUT) |
Allocate
The A in D.A.R.T.S. stands for Allocate. The largest factor determining your rate of return and volatility is the ratio of Growth-Investments (stocks, private equity, real estate, and infrastructure) to Income-Investments (bonds, private credit, and structured contracts). This ratio will explain where approximately 92% of your investment returns come from. The specific funds you choose, your timing, and fees combined comprise less than one-tenth of where you get your returns from!
You focus on allocation first to design a portfolio that supports the withdrawals or growth needed and for the zigging and zagging of values to be comfortable enough for you not to lose sleep over normal gyrations. The general principle is that growth-based investments offer more significant returns over time but tend to zig and zag more than income-based investments. You can reduce the zigging and zagging (volatility risk) by adding income-based investments, which offer more stability but less return.
Mission Wealth’s investment planning process can identify your optimal blend of growth-to-income investments tailored to your exact financial life and cash flow needs. Many investors find it comforting to create a portfolio where income-based investments can cover daily living expenses.
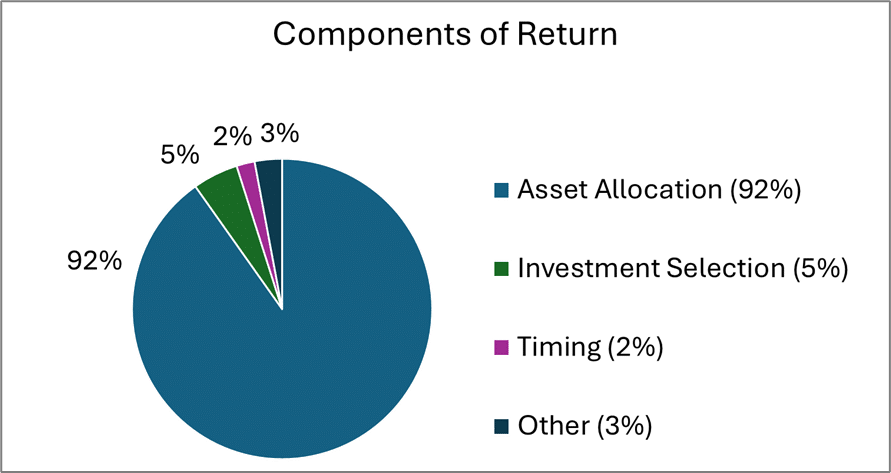
Source: Financial Analysts Journal.
Rebalance & Range
The letter R in D.A.R.T.S. stands for two concepts that coincide: Range and Rebalancing.
Range
Range is the normal volatility (zigging and zagging) you can expect for your given investment allocation. This varies based on how you are invested. For example, the normal range of the S&P 500 returns in any given year is between +43% to -23%. Investing in different markets and reducing volatility can narrow the normal range of movement in your portfolio to a desirable level.
In the chart below, you can see some sample ranges for portfolios invested in public markets. On the vertical axis is the normal range of returns in any given year. On the horizontal axis are different portfolios. To the left, you can see a portfolio with 100% invested in the bond market (noted 0-100), and to the right, you can see a portfolio invested 100% in the stock market (noted 100-0). In between are portfolios with blended amounts, such as 60% in the stock market and 40% in the bond market (noted 60-40).
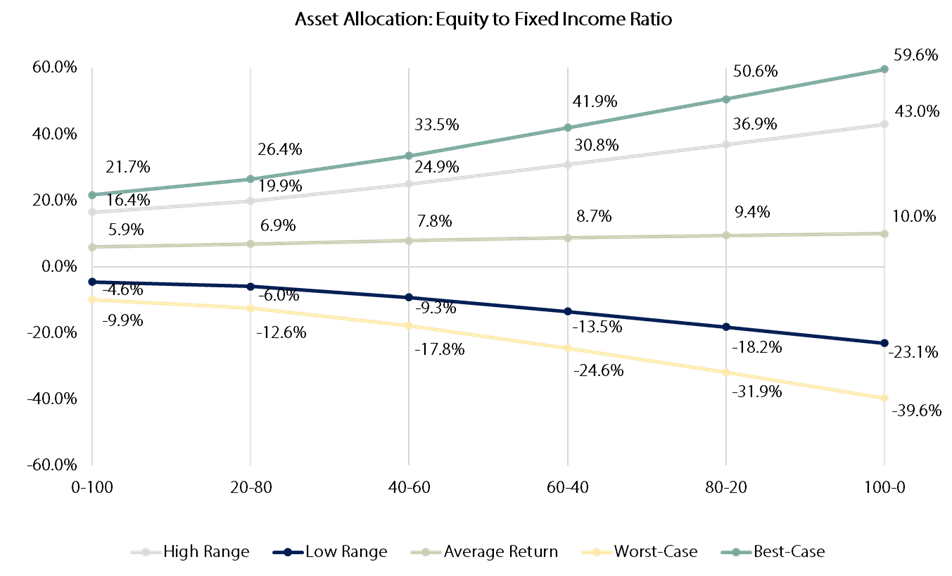
This chart gives you a sense of the normal range (defined as two standard deviations) and the best-case and worst-case range (defined as three standard deviations). Investing is a lot more complicated than picking between two types of investments (stocks and bonds). Many other types of investments should be considered to adjust the target return, normal range of movement, and best/worst range of movement. Working with a professional advisor and investment manager can potentially help reduce risk and improve returns by including more sophisticated investments such as private equity, real estate, private credit, infrastructure, and more.
The key is to know what ‘normal range of movement’ applies to you and to be able to sleep at night when you face the negative side of that normal range. Take one last look at the positive versus negative; they are nearly twice as ‘high’ as the negative ranges are ‘low’. This is why performance averages positively over several years. Yes, some years may be negative, but history shows that markets are positive about 73% of the time and only negative about 27% of the time (Source: Goldman Sachs). Those are good odds!
Rebalance
The second meaning for the letter R in D.A.R.T.S. stands for Rebalance.
Imagine you’re walking in your town, and your favorite store has a sign that reads, “Everything inside is 30% more expensive; sale ends tomorrow!”. Would you go in? Of course not! However, if the sign reads, “Everything inside 30% off, sale ends tomorrow!” you’d hurry inside.
Investors tend to do the opposite of what we all know is common knowledge: they chase performance (i.e., buying when everything is more expensive), and they sell when markets are down (i.e., missing purchase opportunities when there is a big discount!).
Rebalancing solves this. It is the process of selling what has been successfully appreciated to purchase what has been lowered to attractive prices while maintaining target allocations to control risk and maintain your range of movement.
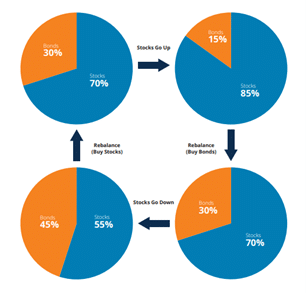
Source: Mirae Asset
See our separate article on Rebalancing for more detailed information.
Tax
The ‘T’ in D.A.R.T.S. refers to Tax, specifically tax-locating and tax-loss-harvesting. We have separate videos on these topics, but in short, they can be summarized as follows:
- Tax Locating is the process of placing different types of investments in the most efficient account types. It makes the most sense to place income-based investments in tax-deferred accounts like IRAs, 401(k)s, and Profit-Sharing Plans. This shelters the income from tax when earned because these accounts only pay tax upon withdrawals. The income can grow and compound without taxes being taken out each year. On the other hand, in the tax-free or capital-gains-tax accounts (such as your Roth, Joint Accounts, or Trusts,) it makes sense to have the highest-growth investments. You will keep the most of these investments because they have the least tax to pay.
- Tax-Loss Harvesting is the process of intentionally selling what has lost value to capture the loss. This is a write-off on your taxes, allowing you to offset it with capital gains. By selling what has gone down, you can collect the tax write-off and repurchase a similar investment to participate in the recovery. An example would be owning Coca-Cola and selling it when it goes down to buy Pepsi. You fully participate in the market but collect losses along every dip to help offset taxable gains. You can see our full explanation of tax-loss harvesting in our insights blog.
Scope
The final letter in D.A.R.T.S. stands for Scope, meant to remind investors of the long-term approach. The market does not operate on our arbitrary twelve-month calendar, nor should you look at your investments that way. Perhaps the most valuable chart to help keep perspective is this chart:
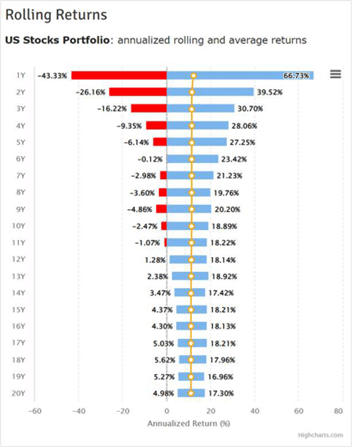
This chart goes back 50 years to show you the best and worst returns over different timelines. When looking at the prior five decades, the worst one-year period was -43% from March 2008 to February 2009. The best one-year period was +66% from July 1982 to June 1983.
Look at the bars when you start expanding the time period. The best consecutive 6-year period was +23% from April 1994 to March 2000, while the worst 6-year period was -0.12% from January 2000 to December 2005. There was no negative period for any consecutive 12 years or more.
This information should be profound: invest short-term money conservatively. However, for money that will sustain you for many years ahead, understand how much more stable the long term is than the short term. Looking at your investments monthly, quarterly, or even annually is good for staying informed. Still, it may not be ideal for keeping your long-term goals on track if the portfolio is over-managed with too many changes in the short term.
Create An Investment Plan
As we welcome the fourth quarter and look back on the third quarter, we hope these concepts help keep you informed about managing market volatility. When markets move downward, the D.A.R.T.S. framework can be helpful to assess how your portfolio is managed.
We hope you found these topics helpful as we enter the new year. We welcome you to read or watch our Chief Investment Officer’s market updates from our Insights Blog for more detailed market commentary.
To submit a request for future topics, please don’t hesitate to email Joey directly at jkhoury@missionwealth.com.
Financial Guidance For Your Life Journey
Talk with a financial planner about your next steps.Guidance For Your Full Financial Journey
Through our comprehensive platform and expertise, Mission Wealth can guide you through all of life's events, including retirement, investment planning, family planning, and more. You will face many financial decisions. Let us guide you through your options and create a plan.
Mission Wealth’s vision is to provide caring advice that empowers families to achieve their life dreams. Our founders were pioneers in the industry when they embraced the client-first principles of objective advice, comprehensive financial planning, coordination with other professional advisors, and proactive service. We are fiduciaries, and our holistic planning process provides clarity and confidence. For more information on Mission Wealth, please visit missionwealth.com.
To schedule a meeting with a Mission Wealth financial advisor, contact us today at (805) 882-2360.
Mission Wealth is a Registered Investment Advisor. This commentary reflects the personal opinions, viewpoints, and analyses of the Mission Wealth employees providing such comments. It should not be regarded as a description of advisory services provided by Mission Wealth or performance returns of any Mission Wealth client. The views reflected in the commentary are subject to change at any time without notice. Nothing in this commentary constitutes investment advice, performance data, or any recommendation that any particular security, portfolio of securities, transaction, or investment strategy is suitable for any specific person. Any mention of a particular security and related performance data is not a recommendation to buy or sell that security. Mission Wealth manages its clients’ accounts using a variety of investment techniques and strategies, which are not necessarily discussed in the commentary. Investments in securities involve the risk of loss. Past performance is no guarantee of future results.
Let's Keep in Touch!
Subscribe for exclusive content and timely tips to empower you on your financial journey. Our communications go straight into your inbox, so you'll never miss out on expert advice that can positively impact your life.Recent Insights Articles

Five Behavioral Biases That Shape How We Care for Aging Parents
December 10, 2025
What Is the Best Way to Bring Fairness and Family Harmony to Your Estate Plan?
December 4, 2025


