
Year-end Tax Insights!

A Tale of Two Decades: Lessons for Long-Term Investors
The first decade of the 21st century, and the second one that’s drawing to a close, have reinforced for investors some timeless market lessons: Returns can vary sharply from one period to another. Holding a broadly diversified portfolio can help smooth out the swings. And focusing on known drivers of higher expected returns can increase the potential for long‑term success. Having a sound strategy built on those principles — and sticking to it through good times and bad — can be a rewarding investment approach.
"The Lost Decade"?
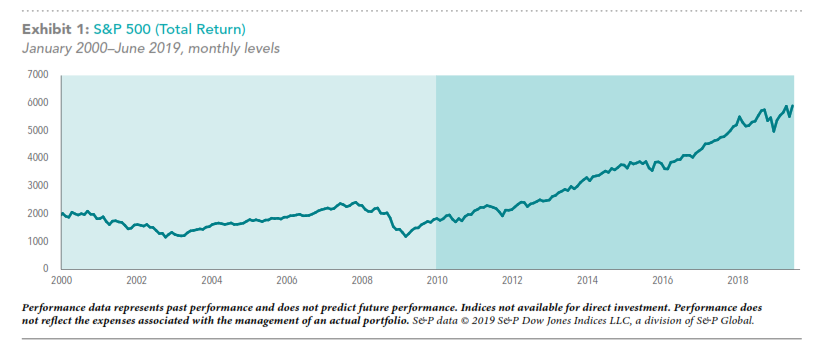
Looking at a broad measure of the US stock market, such as the S&P 500, over the past 20 years, you could be forgiven for thinking of Charles Dickens: It was the best of times and the worst of times (see Exhibit 1). For US large cap stocks, the worst came first. The “lost decade” from January 2000 through December 2009 resulted in disappointing returns for many who were invested in the securities in the S&P 500. An index that had averaged more than 10% annualized returns before 2000 instead delivered less‑than‑average returns from the start of the decade to the end. Annualized returns for the S&P 500 during that market period were − 0.95%.
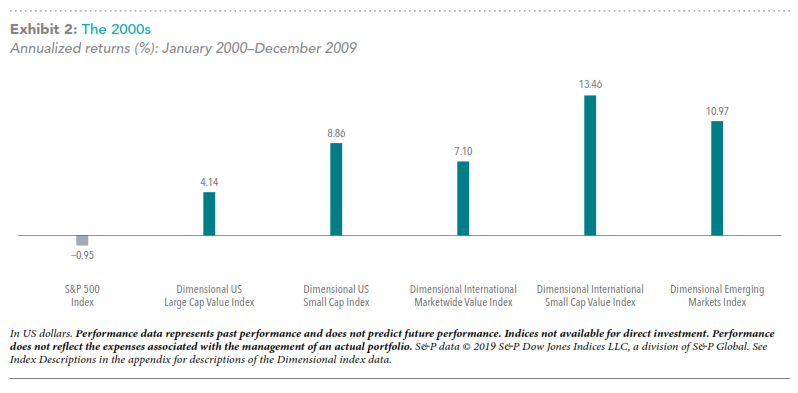
Yet it was a good decade for investors who diversified their holdings globally beyond US large cap stocks and included other parts of the market with higher expected returns — companies with small market capitalizations or low relative price (value stocks). As Exhibit 2 shows, a range of indices across many other parts of the global market outperformed the S&P 500 during that time span.
FLIPPING THE SCRIPT
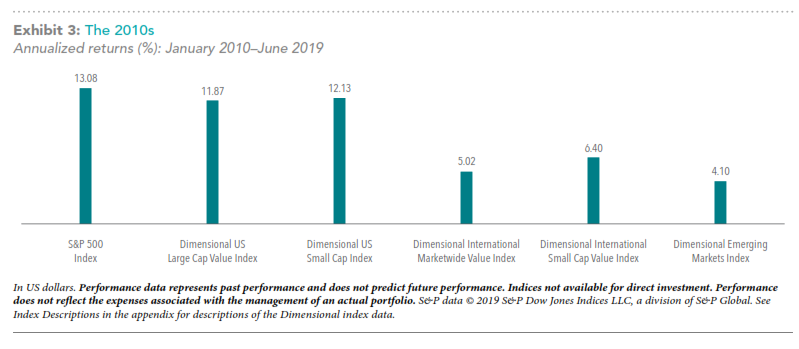
The next period of nine-plus years reveals quite a different story. It has looked more like best of times for the S&P 500, as the index, when viewed by total return, has more than tripled since the start of the decade in the bounce‑back from the global financial crisis. US large cap growth stocks have been some of the brightest stars during this span. Accordingly, from 2010 through the first half of 2019, many parts of the market that performed well during the previous decade haven’t been able to outperform the S&P 500, as Exhibit 3 displays. Since many of these asset classes haven’t kept pace with the S&P, these returns might cause some to question their allocation to the asset classes that drove positive returns during the 2000s.
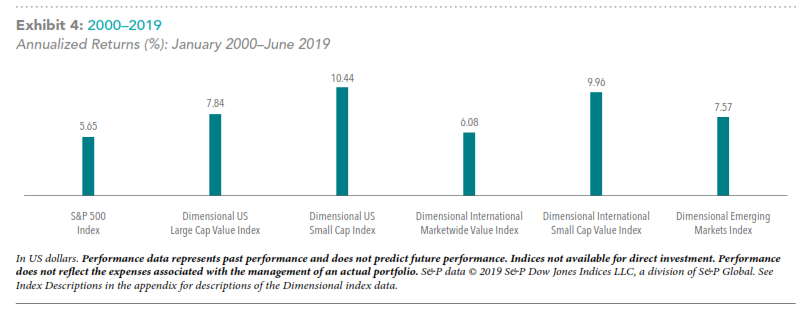
It’s been stated many times that investors may want to take a long‑term perspective toward investing, and the performance of stock markets since 2000 supports this point of view. Over the past 19½ years (see Exhibit 4), investing outside the US presented investors with opportunities to capture annualized returns that surpassed the S&P 500’s 5.65%, despite periods of underperformance, including the most recent nine‑plus years. Cumulative performance from 2000 through June 2019 also reflects the benefits of having a diversified portfolio that targets areas of the market with higher expected returns, such as small and value stocks. And it underscores the principle that longer time frames increase the likelihood of having a good investment experience.
No one knows what the next 10 months will bring, much less the next 10 years. But maintaining patience and discipline, through the bad times and the good, puts investors in position to increase the likelihood of long‑term success.
APPENDIX: Index Descriptions
Dimensional US Large Cap Value Index is compiled by Dimensional from CRSP and Compustat data. Targets securities of US companies traded on the NYSE, NYSE MKT (formerly AMEX), and Nasdaq Global Market with market capitalizations above the 1,000th-largest company whose relative price is in the bottom
30% of the Dimensional US Large Cap Index after the exclusion of utilities, companies lacking financial data, and companies with negative relative price. The index emphasizes securities with higher profitability, lower relative price, and lower market capitalization. Profitability is measured as operating income before depreciation and amortization minus interest expense scaled by book. Exclusions: non-US companies, REITs, UITs, and investment companies. The index has been retroactively calculated by Dimensional and did not exist prior to March 2007. The calculation methodology
for the Dimensional US Large Cap Value Index was amended in January 2014 to include direct profitability as a factor in selecting securities for inclusion in the index. Prior to January 1975: Targets securities of US companies traded on the NYSE, NYSE MKT (formerly AMEX), and Nasdaq Global Market with market capitalizations above the 1,000th-largest company whose relative price is in the bottom 20% of the Dimensional US Large Cap Index after the exclusion of utilities, companies lacking financial data, and companies with negative relative price.
Dimensional US Small Cap Index is compiled by Dimensional from CRSP and Compustat data. Targets securities of US companies traded on the NYSE, NYSE MKT (formerly AMEX), and Nasdaq Global Market whose market capitalization falls in the lowest 8% of the total market capitalization of the eligible market. The index emphasizes companies with higher profitability. Profitability is measured as operating income before depreciation and amortization minus interest expense scaled by book. Exclusions: non-US companies, REITs, UITs, and investment companies. The index has been retroactively calculated by Dimensional and did not exist prior to March 2007. The calculation methodology for the Dimensional US Small Cap Index was amended in January 2014 to include direct profitability as a factor in selecting securities for inclusion in the index. Prior to January 1975: Targets securities of US companies traded on the NYSE, NYSE MKT (formerly AMEX), and Nasdaq Global Market whose market capitalization falls in the lowest 8% of the total market capitalization of the eligible market.
Dimensional International Market-wide Value Index is compiled by Dimensional from Bloomberg securities data. The index consists of companies whose relative price is in the bottom 33% of their country’s companies after the exclusion of utilities and companies with either negative or missing relative price data. The index emphasizes companies with smaller capitalization, lower relative price, and higher profitability. The index also excludes those companies with the lowest profitability and highest relative price within their country’s value universe. Profitability is measured as operating income before depreciation and amortization minus interest expense scaled by book. Exclusions: REITs and investment companies. The index has been retroactively calculated by Dimensional and did not exist prior to April 2008. The calculation methodology for the Dimensional International Market-wide Value Index was amended in January 2014 to include direct profitability as a factor in selecting securities for inclusion in the index.
Dimensional International Small Cap Value Index is defined as companies whose relative price is in the bottom 35% of their country’s respective constituents in the Dimensional International Small Cap Index after the exclusion of utilities and companies with either negative or missing relative price data. The index also excludes those companies with the lowest profitability within their country’s small value universe. Profitability is measured as operating income before depreciation and amortization minus interest expense scaled by book. Exclusions: REITs and investment companies. The index has been retroactively calculated by Dimensional and did not exist prior to April 2008. The calculation methodology for the Dimensional International Small Cap Value Index was amended in January 2014 to include direct profitability as a factor in selecting securities for inclusion in the index. Prior to January 1990: Created by Dimensional, the index includes securities of MSCI EAFE countries in the top 30% of book-to-market by market capitalization conditional on the securities being in the bottom 10% of market capitalization, excluding the bottom 1%. All securities are market capitalization weighted. Each country is capped at 50%; rebalanced semiannually.
Dimensional Emerging Markets Index is compiled by Dimensional from Bloomberg securities data. Market capitalization-weighted index of all securities in the eligible markets. The index has been retroactively calculated by Dimensional and did not exist prior to April 2008. Exclusions: REITs and investment companies.
Dimensional Fund Advisors LP is an investment advisor registered with the Securities and Exchange Commission.
There is no guarantee investment strategies will be successful. Investing involves risks, including possible loss of principal. Investors should talk to their financial advisor prior to making any investment decision. There is always the risk that an investor may lose money. A long-term investment approach cannot guarantee a profit.
Indices are not available for direct investment. Their performance does not reflect the expenses associated with the management of an actual portfolio. Past performance is not a guarantee of future results. Diversification does not eliminate the risk of market loss. All expressions of opinion are subject to change. This information is intended for educational purposes, and it is not to be construed as an offer, solicitation, recommendation, or endorsement of any particular security, products, or services.
00351055 10/19