
Year-end Tax Insights!
2024 Q2 Investor Psychology Commentary
In
/
by Joey S. Khoury, MSFP, CFP®, Partner and Director of Behavioral Finance
/
May 17, 2024

This article/video is part of a series that applies psychology to financial planning so we can all make wealthier decisions. As a multi-billion-dollar investment and planning firm, Mission Wealth can give you collective wisdom and real-life examples from thousands of multimillionaires. You can read 2024 Q1’s Investor Commentary here.
Joey Khoury is one of Mission Wealth’s Senior Wealth Advisors and a adjunct professor at UCSB who has studied behavioral finance at Cornell and Harvard. Every quarter, Joey and Mission Wealth publish 1-3 psychological topics that are relevant and current to the world around us.
Since 2024 is an election year, Joey discusses how the stock market historically reacts to an election and reviews how Americans generally feel about the economy relative to their favored political party. By the end of this update, you will find out if how people feel matches reality.
Watch the Full 7-Minute Video Below
Americans Rank National Economic Conditions Based on Political Party
Pew Research Data shows that Americans generally rank economic conditions better or worse depending on whether their favored political party is in office.
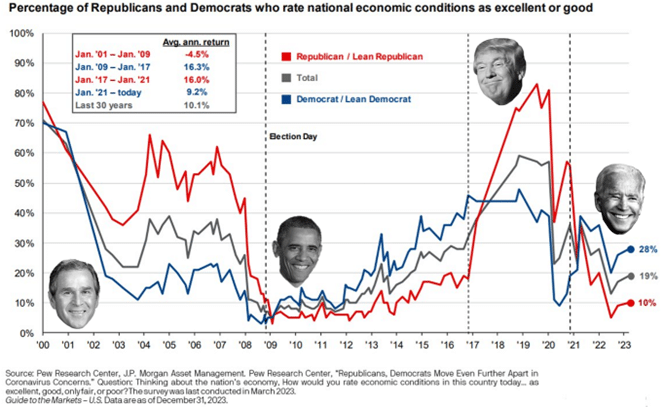
In the chart above, pay close attention to which colored line sits on top. The lines correspond with political parties: red for Republicans and blue for Democrats. Whichever line is on top tells you which voters feel better about the economy.
From 2000 to 2009, when Republican George W. Bush was in office, Republican citizens rated the national economic conditions better than Democratic citizens (the red line was above the blue line when Bush was in office.)
This immediately reverses when Democrat Barack Obama was in office from 2009 to 2017. Suddenly, Democrats are ranking the national economic conditions as good while Republican citizens lose confidence in the economic conditions. The blue line was above the red line.
The trend reversed again when Republican Donald Trump was in office from 2017 to 2021 (the red line now sits above the blue line), and flip flops once more when Democrat Joe Biden entered office in 2021 (the blue line now sits above the red line).
The perception of how healthy the economy is performing largely depends on whether your favored political party is in office. However, is there any data to back this up?
There’s one more curiosity in this chart before we unveil the answer. Did you notice how often both the blue and red lines are below 50%? This would indicate that a minority of voters from both parties felt that economic conditions were good. Said diffidently, a majority felt that economic conditions were NOT good when the line was below 50%.
Does the GDP and Market Support Citizen Views?
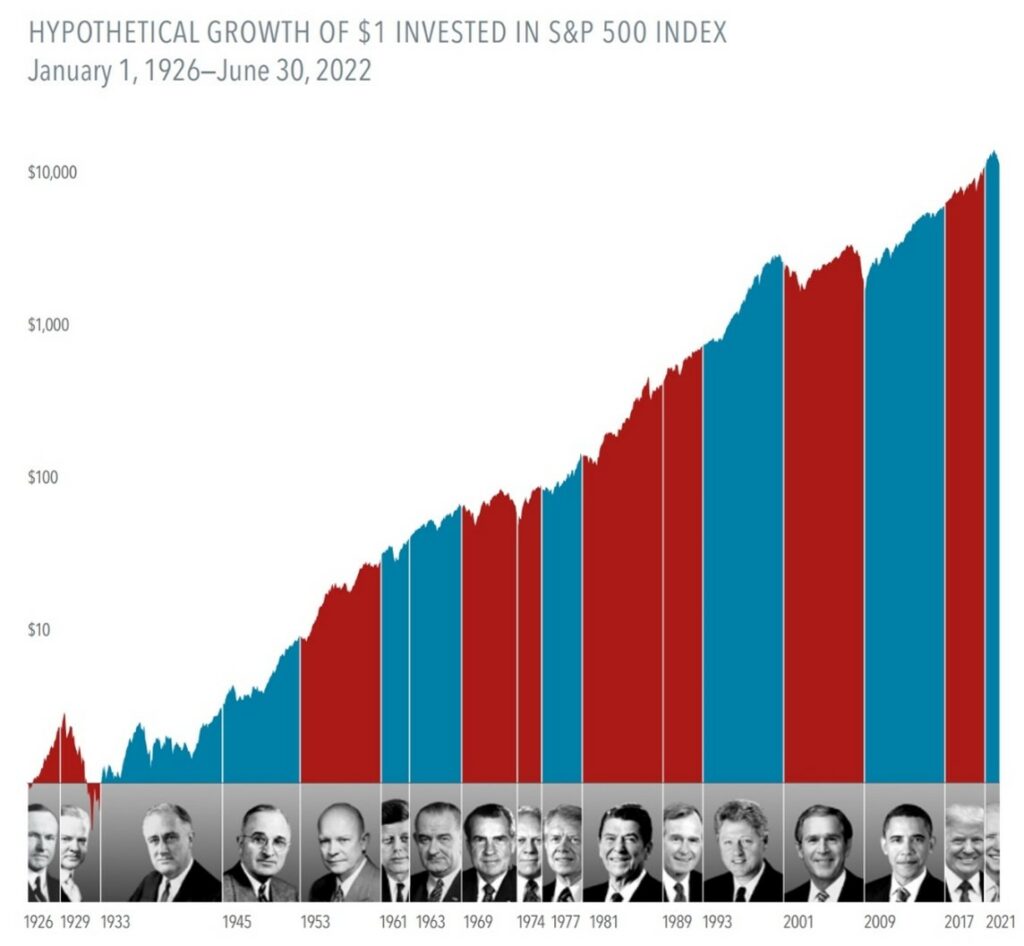
Meanwhile, from 2000-2023 the S&P 500 grew by +250% and the GDP grew by 285%. This is during 2 presidents of each party. How is it possible that the majority of people, for a majority of the time, ranked economic conditions as poor while we’ve had one of the greatest economic expansions in history?
A deeper look into how the stock market (represented by the S&P 500) and the economy (represented by GDP Growth) have fared under each party:
|
Democrats United |
Republicans United |
Divided Gov’t |
|
|
GDP (Average) |
4.0% |
2.8% |
2.7% |
|
Market Returns (Average) |
9.9% |
12.9% |
7.9% |
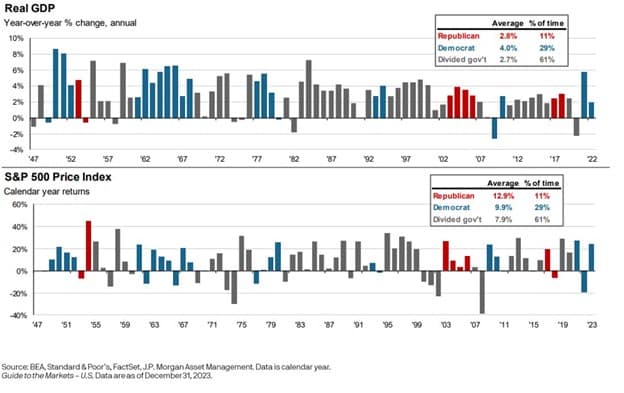
There are three key conclusions:
- Democrats win GPD Growth: A unified government under the Democrats has historically produced better GDP growth compared to Republicans: 4.0% average annual year-over-year real GDP growth under united Democrats vs 2.8% under Republicans.
- Republicans win S&P 500 Growth: A unified government under the Republicans has historically produced better S&P 500 growth compared to Democrats: 12.9% average annual S&P 500 returns under united Republicans vs 9.9% under Democrats.
- Nobody wins when divided: A divided government has historically produced inferior results for both the GDP growth and the S&P 500: 2.7% average year-over-year GDP growth and 7.9% average S&P 500 growth. A united government under either political party has historically performed better on average.
Do Markets Change During Election Years?
What about the chaotic markets during an election year? Many investors have put major financial decisions on hold until the elections pass. Here’s the reality: markets generally don’t care about elections, but recent elections make us feel differently because they were associated with non-political market shocks.
The visual below maps volatility in the market during the 100 days before and after elections. It is important to realize that we had three global events in recent presidential elections, which are unrelated to elections: the 2020 election was met with Covid, the 2008 election was met with the Global Financial Crisis, and the 2000 election was met with the Dot-Com bubble. These can falsely lead people to conclude that markets are risky during election years.
If we strip out these three presidential election years, and instead look at the elections of 1984, 1988, 1992, 1996, 2004, 2012, and 2016 (blue/green lines), we find that markets mostly ignore presidential elections:
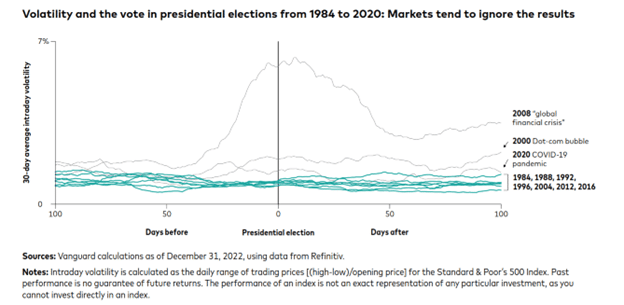
In fact, markets on average are less volatile during presidential election years (14.2% standard deviation) compared to average (15.3%) standard deviation.[i]
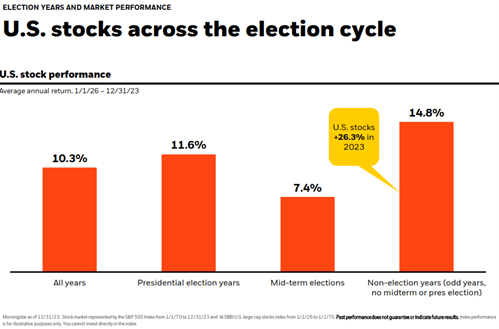
Data going back nearly 100 years points to the same conclusion: presidential elections do not negatively impact markets. Counterintuitively, markets tend to be higher than average during election years (11.6% average election-year returns versus 10.3% average S&P 500 returns since 1926.)
[i] Standard & Poors, FactSet, JPMAM. Election years are presidential election years. Data as of 12/31/2023.
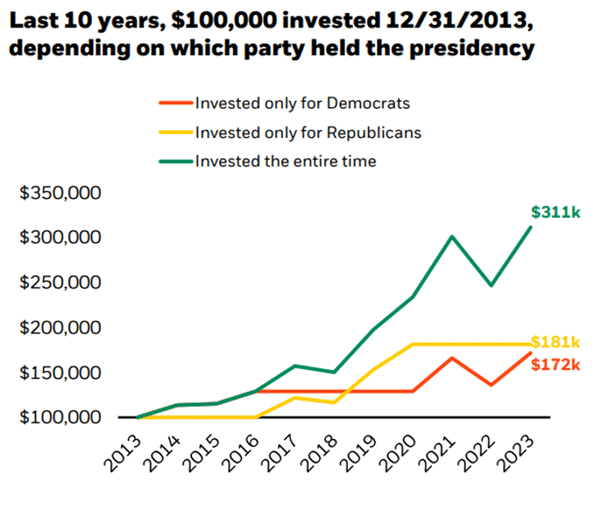
Investing Only When Politically Driven Creates a Major Missed Opportunity
This creates a huge, missed opportunity for investors that are the most politically driven. If you chose to only stay invested when your preferred political party was in office, you may miss out on approximately 45% of all growth in the past 10 years.
Over the past 70 years, you would have missed out on approximately 97% of the growth potential.
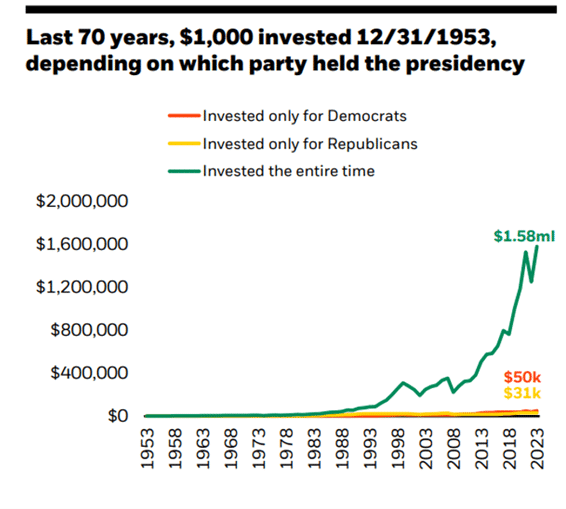
Source: Morningstar as of 12/31/2023. S&P 500 Index from 1/1/70 to 12/31/2023 and IA SBBI U.S. large cap stock index from 1/1/54 to 1/1/70. BlackRock Student of the Market, Presidential Election 2024 Edition.
The Bottom Line? Politics Are Not Profitable.
Four Key Takeaways:
- Companies will always seek to earn profits and innovate regardless of which political party is in office.
- Investors generally tend to have perceptions of economic conditions that are too closely associated with which political party is in office.
- Choosing to invest based on your political preference is a great way to lose out on potential earnings.
- Historically, the market averages higher returns with less volatility during presidential election years.
Human ingenuity, innovation, and progress will not stop due to whichever president warms the seat in the Oval Office.
We hope you found these topics helpful as we enter the new year. For more detailed market commentary, I welcome you to read or watch our Chief Investment Officer’s market updates from our Insights Blog.
To submit a request for future topics, please don’t hesitate to email Joey directly at jkhoury@missionwealth.com.
Customized Investment Management Solutions
At Mission Wealth, we develop customized, globally diversified, tax-efficient portfolios tailored to your financial plan and built to stand the test of time. Contact us below for a free portfolio review.Get Started Today
Investment Advice Fit For Your Needs
At Mission Wealth, we are deeply rooted in an evidence-based investment strategy built on decades of Nobel Prize-winning research. We ignore the media noise and Wall Street hype, relying instead on a long-term approach and proven principles that reward investors over time. For more information on Mission Wealth's investment strategies, please visit missionwealth.com.
To meet with a Mission Wealth financial advisor, please contact us online today or call us at (805) 882-2360.
Mission Wealth is a Registered Investment Advisor. This commentary reflects the personal opinions, viewpoints, and analyses of the Mission Wealth employees providing such comments. It should not be regarded as a description of advisory services provided by Mission Wealth or performance returns of any Mission Wealth client. The views reflected in the commentary are subject to change at any time without notice. Nothing in this commentary constitutes investment advice, performance data, or any recommendation that any particular security, portfolio of securities, transaction, or investment strategy is suitable for any specific person. Any mention of a particular security and related performance data is not a recommendation to buy or sell that security. Mission Wealth manages its clients’ accounts using a variety of investment techniques and strategies, which are not necessarily discussed in the commentary. Investments in securities involve the risk of loss. Past performance is no guarantee of future results.
MISSION WEALTH IS A REGISTERED INVESTMENT ADVISOR. ALL RIGHTS RESERVED. 00598752 05/24
Let's Keep in Touch!
Subscribe for exclusive content and timely tips to empower you on your financial journey. Our communications go straight into your inbox, so you'll never miss out on expert advice that can positively impact your life.Recent Investment Insights Articles

Market Update 6/10/26
June 10, 2026Market volatility, rising inflation, geopolitical uncertainty, and shifting leadership underscore the importance of diversification, disciplined rebalancing, and a long-term investment strategy....

Market Perspectives Q2 2026
May 21, 2026Explore our latest market update as resilient economic growth, strong corporate earnings, and evolving Fed expectations shape opportunities across stocks, bonds, and global markets....

How Effective is the “Sell in May” Strategy for High-Net-Worth Investors?
May 21, 2026What should investors do before summer market volatility? Learn how retirees and high-net-worth families can prepare through liquidity planning, portfolio rebalancing, and tax-aware investment strategies....