2024 Q1 Investor Psychology Commentary
This article/video is part of a series that applies psychology to financial planning so we can all make wealthier decisions. As a multi-billion-dollar investment and planning firm, Mission Wealth can give you collective wisdom and real-life examples from thousands of multimillionaires.
Joey Khoury is one of Mission Wealth’s Senior Wealth Advisors and an adjunct professor at UCSB who has studied behavioral finance at Cornell and Harvard. Joey and Mission Wealth plan to publish 1-3 psychological topics that are relevant to what’s going on in the world around us. To kick off the new year, we chose the topics of holding cash, market timing to avoid in 2024, and whether international conflict should play into your investment decisions.
Watch the Video Below
Topic #1: Cash & Recency Bias
In 2023 the asset class that had the most amount of inflows was cash, with a whopping $1.3 trillion of value moving to cash positions last year. While a +5% interest on cash appealed to many investors in 2023, the expected interest rate cuts over the next 12 to 24 months will prove cash to be a short-lived opportunity. As interest rates drop, this cash will have to go somewhere.
Investors trying to make this decision by timing short-term industry trends will likely be punished. Our brains are wired to make decisions that are over-reliant on the most recent data and events (a well-documented psychological error called Recency Bias). This gets us into a whole lot of trouble when we start making investment decisions because we often make long-term decisions based on short-term information.
Take, for example, the large gains of growth stocks in 2023. The Vanguard Growth Fund (ticker VUG) posted +46% in 2023. Investors will likely compare this to the Vanguard Value Fund (ticker VTV), which only earned +9% in 2023. Investors who notice this difference may ask “Why do I hold value stocks when growth is doing so well?” If we rewind to 2022, a negative year, growth was among the worst performers (-33%) and value was among the best (-2%). This led investors to ask the exact opposite question: “Why do I hold growth stocks when value stocks are much less risky?”

The two-year returns over both 2022 and 2023 were greater for value stocks than for growth stocks despite growth stocks posting +46% last year. The key point: building a consistent portfolio means less of your dollars must work as hard to make up for prior losses. The more you lose, the more you have to earn to break even: a 10% loss needs an 11% gain to break even, a 20% loss needs a 25% gain to break even, a 33% loss needs a 50% gain to break even, and a 50% loss needs a 100% gain to break even.
While it can be uncomfortable to systematically sell while the price is high and buy while the price is low and (a process called rebalancing), history shows that it can create a smoother ride and comparable cumulative returns to the market. Over several years, avoiding the big market busts can be more profitable and emotionally easier than chasing the big booms.
Take this comparative sample portfolio with 60% in the stock markets and 40% in the bond market versus the S&P 500 since 2000. In positive markets, investors feel bad about not earning as much as the S&P 500. In negative markets, investors are not happy about losing any money at all (even if their diversified portfolio did not go as far down as the general market). There will always be a reason to be unhappy with relative performance when times are both good and bad.
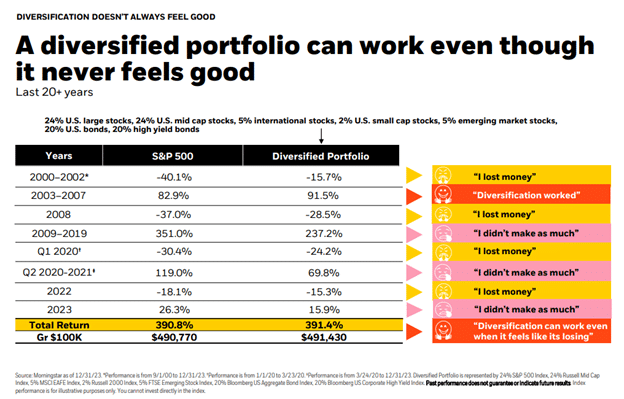
The key takeaway: when making investment decisions, it’s best to take a longer-than-one-year perspective. If you can keep a 3–5-year focus on investment decisions, you will be doing yourself a financial favor with less of an emotional ride.
Topic #2: Gambler’s Fallacy & Recency Bias
Last year (2023) the S&P 500 grew by about 24% and ended on a very positive note in the fourth quarter. Concerns that 2024 will be a negative year to compensate have started to bubble up. While nobody has a crystal ball to foresee the market performance on a short-term basis, some history of how markets have behaved can help guide how we think about this ‘reversion risk’.
Simply put, the markets don’t follow a calendar like we do. For my fellow nerds, data does not indicate that mean reversion occurs on an alternating calendar year basis.
Here are some key points from the history of positive and negative years in the S&P 500 since 1928:
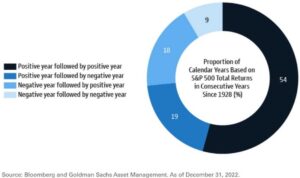
- Markets were positive about 73% of the time and negative about 27% of the time. Playing the long game means staying the course when you’re in the red 27% of the time, knowing that the larger number of good times outweigh the bad times.
- Markets are only back-to-back negative about 9% of the time.
- When markets have a positive year, they have historically followed with another positive year 54% of the time and followed with a negative year only 19% of the time.
With history as a guide, this can help you contextualize the urge to think that we are ‘overdue’ simply because the prior year was positive. But still, there are headlines of crises all around the world. Surely these will contribute to negative markets, right? This brings us to our third and final topic for this quarter: international conflict.
Topic #3: International Conflict & Salience Bias
Billy Joel said it best: “We didn’t start the fire; it was always burning since the world’s been turning”. Wars, famine, natural disasters, political rebellion, and protests reach global attention with technology allowing us to instantly communicate from any corner of the world. The issue is that we all face Salience Bias, which is our inclination to give too much importance to emotionally impactful information.
While sympathizing with humanitarian crises, many investors also grow concerned with how international conflict may affect their life savings. Russia and Ukraine, Israel and Palestine, protests in Iran, natural disasters in Japan, rebellions in the Democratic Republic of Congo, and so many more headlines that will make you want to bury your head in the sand.
Ultimately, you may wonder: How much does international conflict affect the U.S. stock market? To answer this, we tracked how much revenue each country contributed to the revenue of the S&P 500.
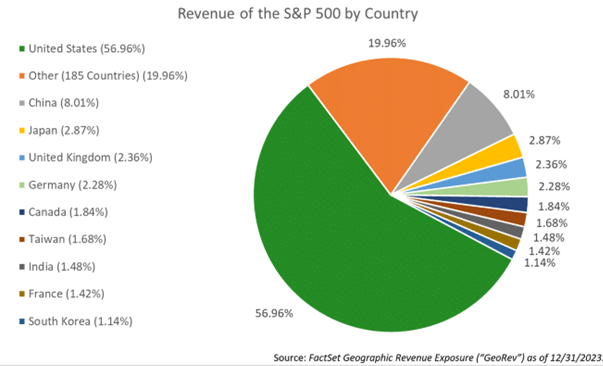
More than half of the revenue from U.S. Large Companies was generated within the United States. In total, there are only 9 countries that exceed a 1% contribution to the S&P 500 revenue. These are China at 8%, Japan at 2.9%, the UK at 2.4%, Germany at 2.3%, Canada at 1.8%, Taiwan at 1.7%, India at 1.5%, France at 1.4%, and South Korea at 1.1%. Outside of the top 9 countries, the other 185 countries contribute a total of 20% revenue. That’s an average of 0.11% per country listed in the ‘other’ category.
What does this mean? Take the conflict in Russia and Ukraine or Israel and Palestine. These countries fit into the ‘other’ category, with an average S&P 500 revenue of 0.11% per country. The market revenue is not impacted by these countries because the companies within the market do not source much revenue from these countries. This does not mean that we can’t care from a humanitarian perspective. Instead, it signifies that the U.S. marketplace is mostly independent, and that the international revenue produced by U.S. Companies is well-diversified across the globe.
In times of turmoil, U.S. markets have historically shrugged off international conflict. Dating back to 1939, data analyzing what happens to the S&P 500 around dozens of geopolitical events indicate that on average the U.S. market tends to take just 3 weeks to reach a bottom and another 3 weeks to recover to prior levels.
To name a few examples: it took the S&P 500 9 days to recover from 2016’s Brexit, 16 days to recover from the 2003 war in Iraq, 9 days to recover from the 1962 Cuban Missile Crisis, 1 day to recover from JFK’s assassination in 1963, 14 days to recover from the 2014 Ukraine conflict, and 15 days to recover from the 911 attacks in 2001. In the year following geopolitical events, the market earned +13% on average.
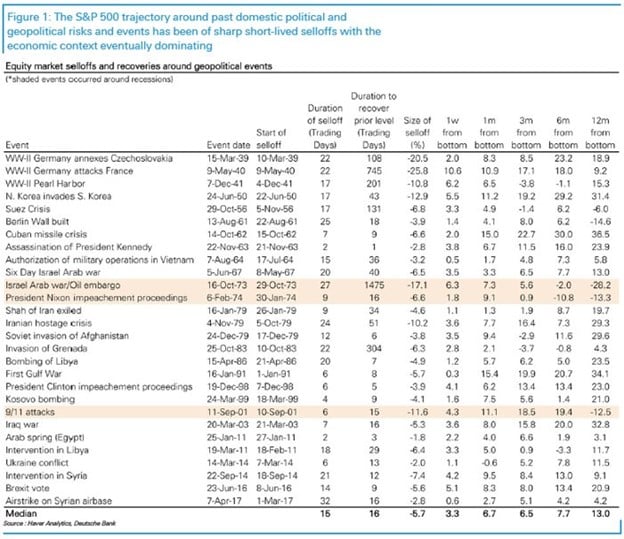
Even with this crystal-clear data, some investors may still be concerned about U.S. government spending on international conflict. Here’s how material our foreign aid is relative to our federal budget and GDP:
- In 2023 the federal government budget for international aid was about $60B, which was about 1% of the $6.1 trillion total federal budget.
- All of government spending accounts for about 25% of the U.S. GDP.
- Since foreign aid is only about 1% of total government spending, and total government spending makes up less than 25% of our GDP, the total impact of foreign aid spending on our GDP is less than 0.25% (1% x 25%).
There remains 99.75% of our GDP unaffected by foreign aid. Yet, there are no articles online that will contextualize this. We can get caught in the crosshairs of the attention-seeking media headlines when most countries represent less than 1% of our market’s revenue, foreign aid represents less than 1% of the federal budget, and international spending on aid represents less than 0.25% of our GDP.
We hope you found these topics helpful as we enter the new year. For more detailed market commentary, we welcome you to read or watch our Chief Investment Officer’s market updates from our Insights Blog.
To submit a request for future topics, please don’t hesitate to email Joey directly at jkhoury@missionwealth.com.
Financial Guidance For Your Life Journey
Talk with a financial planner about your next steps.Guidance For Your Full Financial Journey
Through our comprehensive platform and expertise, Mission Wealth can guide you through all of life's events, including retirement, investment planning, family planning, and more. You will face many financial decisions. Let us guide you through your options and create a plan.
Mission Wealth’s vision is to provide caring advice that empowers families to achieve their life dreams. Our founders were pioneers in the industry when they embraced the client-first principles of objective advice, comprehensive financial planning, coordination with other professional advisors, and proactive service. We are fiduciaries, and our holistic planning process provides clarity and confidence. For more information on Mission Wealth, please visit missionwealth.com.
To schedule a meeting with a Mission Wealth financial advisor, contact us today at (805) 882-2360.
Mission Wealth is a Registered Investment Advisor. This commentary reflects the personal opinions, viewpoints, and analyses of the Mission Wealth employees providing such comments. It should not be regarded as a description of advisory services provided by Mission Wealth or performance returns of any Mission Wealth client. The views reflected in the commentary are subject to change at any time without notice. Nothing in this commentary constitutes investment advice, performance data, or any recommendation that any particular security, portfolio of securities, transaction, or investment strategy is suitable for any specific person. Any mention of a particular security and related performance data is not a recommendation to buy or sell that security. Mission Wealth manages its clients’ accounts using a variety of investment techniques and strategies, which are not necessarily discussed in the commentary. Investments in securities involve the risk of loss. Past performance is no guarantee of future results.
Let's Keep in Touch!
Subscribe for exclusive content and timely tips to empower you on your financial journey. Our communications go straight into your inbox, so you'll never miss out on expert advice that can positively impact your life.Recent Insights Articles

Turning Age 65 in 2026? Why Medicare Planning Should Start Before Your Birthday
January 20, 2026
Mission Wealth Strengthens Leadership with 2026 Partner Class
January 14, 2026


