
Year-end Tax Insights!

The Index Bogeyman
Over the last several years, index funds have received increased attention from investors and the financial media. Some have even made claims that the increased usage of index funds may be distorting market prices. For many, this argument hinges on the premise that indexing reduces the efficacy of price discovery. If index funds are becoming increasingly popular and investors are “blindly” buying an index’s underlying holdings, sufficient price discovery may not be happening in the market.
But should the rise of index funds be a cause of concern for investors? Using data and reasoning, we can examine this assertion and help investors understand that markets continue to work, and investors can still rely on market prices despite the increased prevalence of indexing.
MANY BUYERS AND SELLERS
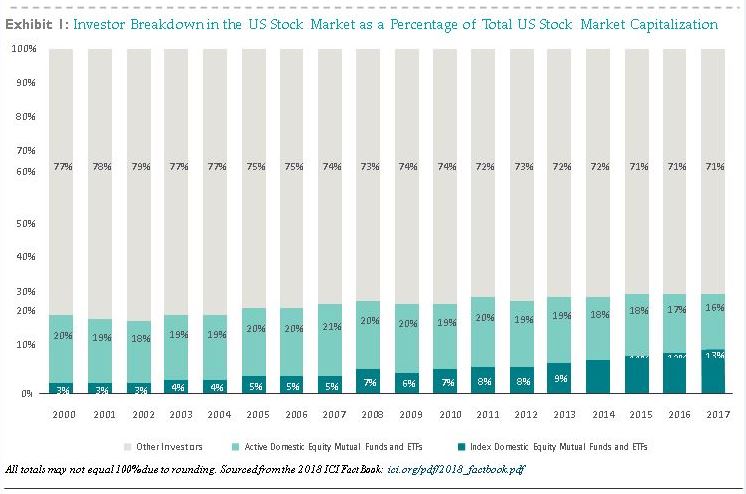
While the popularity of indexing has been increasing over time, index fund investors still make up a relatively small percentage of overall investors. For example, data from the Investment Company Institute1 shows that as of December 2017, 35% of total net assets in US mutual funds and ETFs were held by index funds, compared to 15% in December of 2007. Nevertheless, the majority of total fund assets (65%) were still managed by active mutual funds in 2017. As a percentage of total market value, index-based mutual funds and ETFs also remain relatively small. As shown in Exhibit 1, domestic index mutual funds and ETFs comprised only 13% of total US stock market capitalization in 2017.
In this context, it should also be noted that many investors use nominally passive vehicles, such as ETFs, to engage in traditionally active trading. For example, while both a value index ETF and growth index ETF may be classified as index investments, investors may actively trade between these funds based on short-term expectations, needs, circumstances, or for other reasons. In fact, several index ETFs regularly rank among the most actively traded securities in the market.
The argument that increased usage of index funds may be distorting market prices hinges on the premise that indexing reduces the efficacy of price discovery. But should the rise of index funds be a cause of concern for investors?
Beyond mutual funds, there are many other participants in financial markets, including individual security buyers and sellers, such as actively managed pension funds, hedge funds, and insurance companies, just to name a few. Security prices reflect the viewpoints of all these investors, not just the population of mutual funds.
As Professors Eugene Fama and Kenneth French point out in their blog post titled “Q&A: What if Everybody Indexed?”, the impact of an increase in indexed assets also depends to some extent on which market participants switch to indexing:
“If misinformed and uninformed active investors (who make prices less efficient) turn passive, the efficiency of prices improves. If some informed active investors turn passive, prices tend to become less efficient. But the effect can be small if there is sufficient competition among remaining informed active investors. The answer also depends to some extent on the costs of uncovering and evaluating relevant knowable information. If the costs are low, then not much active investing is needed to get efficient prices.”2
WHAT’S THE VOLUME?
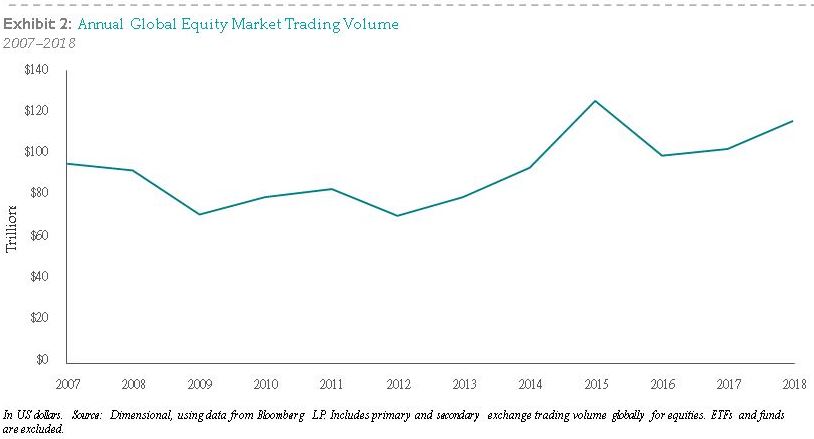
Trade volume data are another place to look for evidence of well-functioning markets. Exhibit 2 shows that despite the increased prevalence of index funds, annual equity market trading volumes have remained at similar levels over the past 10 years. This indicates that markets continue to facilitate price discovery at a large scale.
Besides secondary market trading, there are also other paths to price discovery through which new information can get incorporated into market prices. For example, companies themselves can impact prices by issuing stock and repurchasing shares. In 2018 alone, there were 1,633 initial public offerings, 3,492 seasoned equity offerings, and 4,148 buybacks around the world.3 The derivatives markets also help incorporate new information into market prices as the prices of those financial instruments are linked to the prices of underlying equities and bonds. On an average day in 2018, market participants traded over 1.5 million options contracts and $225 billion worth of equity futures.3
HYPOTHESIS IN PRACTICE
Even though the historical empirical evidence suggests that the rise of indexing is unlikely to distort market prices, let’s consider the counterargument that the rise of indexing does distort markets and in turn causes prices to become less reliable. In this scenario, wouldn’t one expect stock- picking managers attempting to capture mispricing to have an increased rate of success over time?
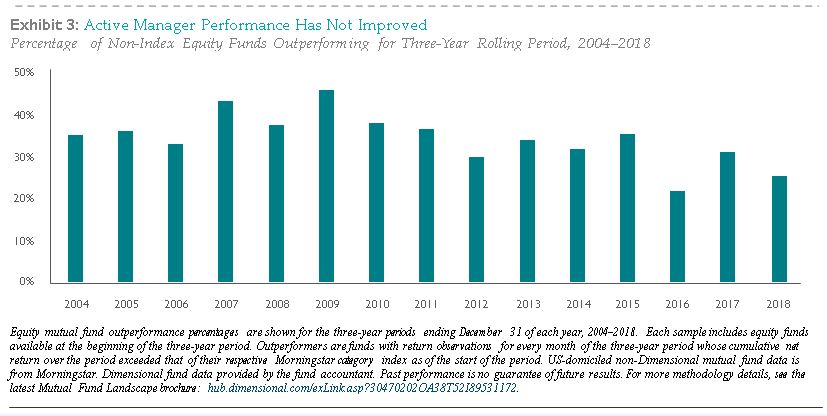
Exhibit 3 shows little evidence that this has been the case. This chart shows the percentage of active managers that survive and beat their benchmarks over rolling three-year periods. These data show that there is no strong evidence of a link between the percentage of equity mutual fund assets in index funds and the percentage of active funds outperforming benchmark indices.
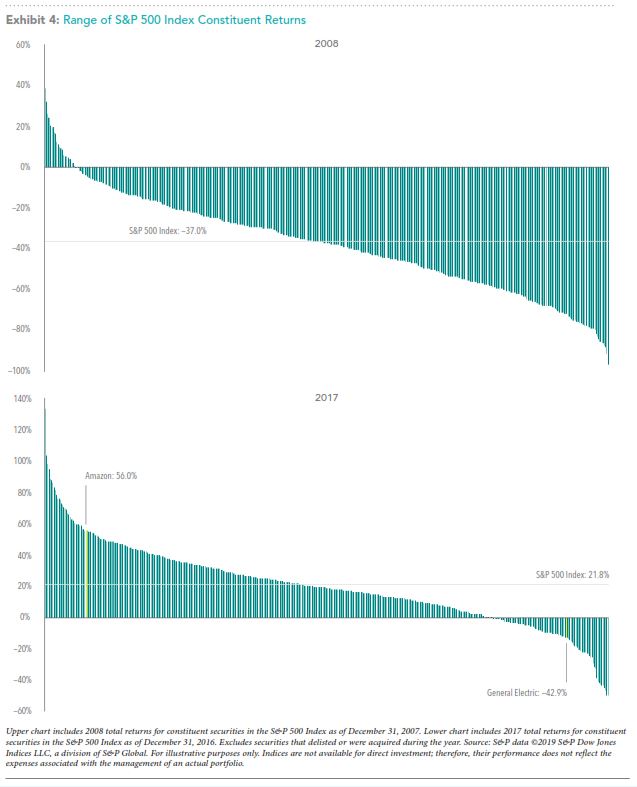
Lastly, in a world where index funds bias prices, we should expect to see evidence of such an impact across an index fund’s holdings. In other words, there should be more uniformity in the returns for securities within the same index as inflows drive prices up uniformly (and outflows drive prices down). Taking the S&P 500 Index as an example, however, we see that this has not been the case. The S&P 500 is a widely tracked index with over $9.9 trillion USD indexed or benchmarked to the index and with indexed assets comprising approximately $3.4 trillion USD of this total.4
Exhibit 4 shows that in 2008, a year of large net outflows and an index return of –37%, the constituent returns ranged from 39% to –97%. This exhibit also shows that in 2017, a year of large net inflows and a positive index return of 21.8%, the constituent returns ranged from 133.7% to –50.3%. We would also expect that constituents with similar weighting in traditional market cap-weighted indices would have similar returns. In 2017, Amazon and General Electric returned 56.0% and –42.9%, respectively, despite each accounting for approximately 1.5% of the S&P 500 Index.
CONCLUSION
Despite the increased popularity of index-based approaches, the data continue to support the idea that markets are working. Annual trading volume continues to be in line with prior years, indicating that market participant transactions are still driving price discovery. The majority of active mutual fund managers continue to underperform, suggesting that the rise of indexing has not made it easier to outguess market prices. Prices and returns of individual holdings within indices are not moving in lockstep with asset flows into index funds.
Lastly, while naysayers will likely continue to point to indexing as a hidden danger in the market, it is important that investors keep in mind that index funds are still a small percentage of the diverse array of investor types. Investors can take comfort in knowing that markets are still functioning; willing buyers and sellers continue to meet and agree upon prices at which they desire to transact. It is also important to remember that while indexing has been a great financial innovation for many, it is only one solution in a large universe of different investment options.
GLOSSARY
Derivative: A financial instrument whose value is based on an underlying asset or security.
Options Contract: An options contract is an agreement between two parties to facilitate a potential transaction on an underlying security at a preset price.
Futures: A financial contract obligating the buyer to purchase an asset or a seller to sell an asset at a predetermined future time and price.
1. ici.org/pdf/2018_factbook.pdf
2. famafrench.dimensional.com/questions-answers/qa-what-if-everybody-indexed.aspx
3. Options, futures, and corporate action data are from Bloomberg LP. Options contact volume is the sum of the 2018 daily average put and call volume of options on the S&P 500 Index, Russell 2000 Index, MSCI EAFE Index, and MSCI Emerging Markets Index. Equity futures volume is equal to total 2018 futures volume traded divided by 252, where annual volume traded is estimated as the sum of monthly volume times month- end contract value for S&P 500 Mini futures, Russell 2000 Mini futures, MSCI EAFE Mini futures, and MSCI Emerging Markets Mini futures. IPO, seasoned equity offering, and share repurchase data are based on Bloomberg corporate actions data and include countries that are eligible for Dimensional investment.
4. Source: S&P Dow Jones.
This article was originally created by Dimensional Fund Advisors. Dimensional Fund Advisors LP is an investment advisor registered with the Securities and Exchange Commission.
Past performance is no guarantee of future results. This information is provided for educational purposes only and should not be considered. Investment advice or a solicitation to buy or sell securities. There is no guarantee an investing strategy will be successful. Investing involves risks including possible loss of principal. Diversification does not eliminate the risk of market loss. Indices are not available for direct investment. Their performance does not reflect the expenses associated with the management of an actual portfolio. All expressions of opinion are subject to change. This article is distributed for informational purposes, and it is not to be construed as an offer, solicitation, recommendation, or endorsement of any particular security, products, or services. Investors should talk to their financial advisor prior to making any investment decision. Eugene Fama and Ken French are members of the Board of Directors of the general partner of, and provide consulting services to, Dimensional Fund Advisors LP.
MISSION WEALTH CONCENTRATED STOCK SOLUTIONS
Having a concentrated position in a single stock carries unique challenges. Even if the stock has historically performed well, you may want more diversification, and history would suggest that it is wise to diversify. You may have come into a large stock concentration via an inheritance, a position that has performed exceptionally over time, or stock compensation at work (options, RSUs, 10b5-1 plan).
At Mission Wealth, we have the capability to work with clients who are seeking more specialized investment solutions. As a part of our Private Client Solution, we offer concentrated stock solutions. The Exchange Fund allows investors who have at least a $5MM net worth transfer their highly appreciated concentrated stock position into a diversified S&P 500-like fund without triggering capital gains taxes. This allows our clients to diversify their portfolio in a very tax efficient manner.
Every Exchange Fund is different, please reference the prospectus for details prior to investing. Information provided here is to be viewed as general in nature. Investors need to financially qualify for certain transactions or products. Please seek professional advice, including tax and legal.
1129435 4/19