
Year-end Tax Insights!

Market Perspectives Q1 2022
By Kieran Osborne, MBus, CFA®
Partner, Chief Investment Officer
Welcome to Mission Wealth’s market perspectives for the first quarter of 2022. I’m Kieran Osborne, Chief Investment Officer at Mission Wealth and I’m excited to be presenting our outlook on the economy and financial markets.
This presentation will cover three broad themes: an update on the market, our thoughts on the economy, and our outlook moving forward.
Key Themes
After finishing 2021 strongly, stocks have taken a breather to begin this year. Concerns around the Fed’s policy pivot and the outlook for interest rates have particularly weighed on markets, with financial conditions beginning to tighten globally, though still at historically easy levels. Indicators of risk sentiment and positioning now appear more favorable for the stock market, while divergence in asset class performance may offer enhanced rebalancing opportunities. Bond yields have risen, and there remains a lot of uncertainty regarding the outlook for interest rates.
Turning to the economy, omicron caused a large spike in cases, though it proved to be less severe. The U.S. may be past the peak, which should help economic growth and the supply chain moving forward. The strength of the consumer may help underpin above-trend economic growth for the foreseeable future, while accommodative policies begin to wear off. Inflation may migrate lower in the second half of 2022 as manufacturing bottlenecks ease and virus improvements reduce production disruptions. With this backdrop, the Fed has indicated it may begin raising the fed funds rate in March and we anticipate the Fed will increase rates by a full 1% by the end of the year.
With this backdrop, what is our outlook for financial markets? Two key stock market themes we see unfolding are: 1) a moderation in stock market returns from the significant strength witnessed over recent years, and 2) an increase in volatility in-line with historic norms. We maintain a positive long-term outlook for stocks and believe this backdrop may provide us with enhanced rebalancing opportunities. International and emerging markets stocks in particular may offer upside potential.
Given the outlook for interest rates, we think longer-dated fixed income securities may be challenged and have positioned ourselves accordingly.
We favor our direct investment strategies which may be well-positioned to continue to generate attractive yield, low correlation to the stock market, and low levels of interest rate risk.
Mission Wealth Actions

First and foremost, we continue to maintain our disciplined approach to portfolio rebalancing which forces us to “buy low and sell high”. Increased volatility and divergence in performance across asset classes increasingly allows for enhanced rebalancing opportunities. For instance, we had been trimming back on U.S. Growth stocks towards the end of 2021 based on relative outperformance at the time. Growth stocks have since underperformed to begin 2022.
We continue to favor dedicated allocations to global equities. We hold a positive long-term view and believe the macro environment remains supportive. Any near-term volatility may offer a rebalancing opportunity.
Our core bond allocations are positioned with less duration risk (interest rate sensitivity) than the broad bond market and we have actively avoided areas of fixed income most susceptible to interest rate changes, such as Treasuries with maturities of 10 years or more.
We have increased our exposure to less liquid income-oriented strategies, which we believe offer attractive risk-adjusted returns, low levels of interest rate risk and low correlation to the stock market.
Ultimately, we continue to focus on long-term fundamentals and believe our portfolios are well positioned to continue to meet the financial goals of our clients.
Market Update
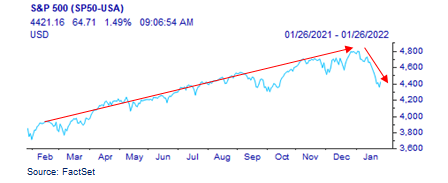
Despite a lot of headline risks –including omicron, inflation, and fiscal policy – stocks ended 2021 positively, marking the third straight year of gains.
This has since given way to concerns around the Fed’s policy pivot and the outlook for interest rates, which has weighed on markets so far this year.
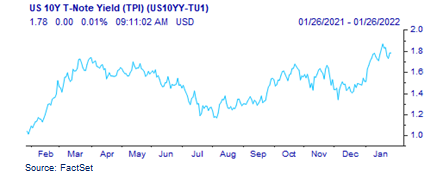
The benchmark 10-year Treasury climbed above 1.85 percent, after ending 2021 at 1.51 percent and up from 1.2 percent in August of 2021.
The market now anticipates the Fed may raise the fed funds rate by a full 1 percentage point or more in 2022.
We’ve also witnessed some dispersion in returns across asset classes which has allowed for enhanced rebalancing opportunities.
For instance, Growth and Value stocks are witnessing a similar dynamic as what played out at the beginning of 2021, with Value stocks doing relatively better so far this year.
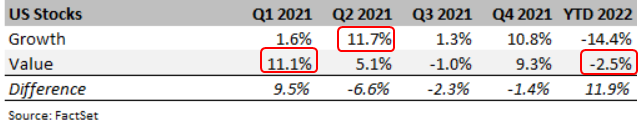
Anticipation of rising rates has helped financials in particular, which tend to be more value-oriented businesses, while it has largely hurt growth-oriented stocks. There have also been concerns around stretched valuations for growth companies which have weighed on those stocks.
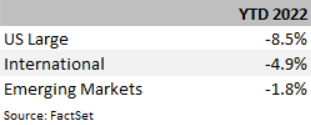
Dispersion in performance across asset classes underpins the importance of a disciplined approach to portfolio construction and periodic rebalancing. Not only do we have dedicated allocations to Value stocks, but also to International and Emerging Markets, both of which have held up relatively well so far vs. the broad U.S. market.
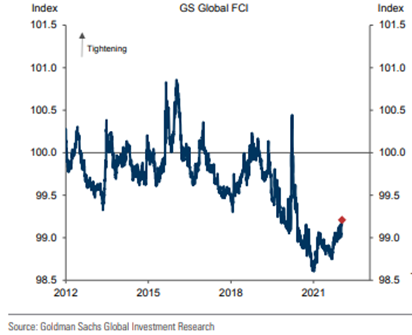
This chart depicts the markets' key concern. Tightening financial conditions globally – led by increased yields and tightening spreads – has caused the uptick in recent market volatility. Though, despite the recent rise in rates, global financial conditions remain very easy by historic standards.
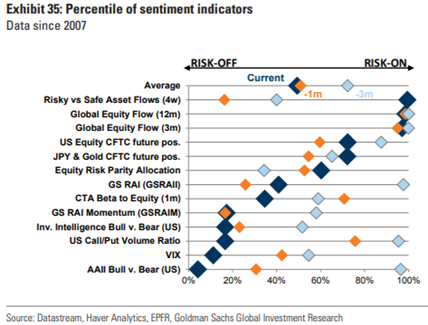
At the same time, measures of risk sentiment appear constructive for stocks. Risk appetite indicators are very low and this has historically been associated with favorable entry points.
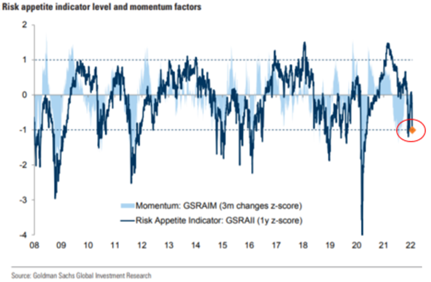
While current risk sentiment indicators are fairly balanced, though tilting towards risk-off, which is a constructive sign for stocks.
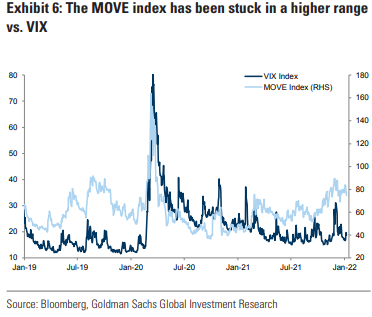
What’s really interesting about the start to this year is the fixed income market has experienced greater relative volatility vs. stocks. This chart depicts the MOVE Index relative to the more commonly followed VIX Index. The VIX is often referred to as the “fear index” for the stock market. Think of the MOVE as the equivalent “fear Index” for bonds. They’re on different scales, but what’s clearly evident is all the uncertainty around the Fed’s policy pivot and the outlook for rate increases has caused an uptick in fixed income volatility.
Next, we’ll take a look at the Economy.
The Economy
Economic developments still remain tied to COVID. Omicron caused a large spike in cases given its transmissibility but has proven to be far less severe than prior variants.
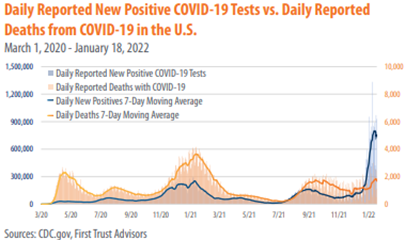
This is highlighted in the decoupling between cases and deaths, with total fatality rates declining.
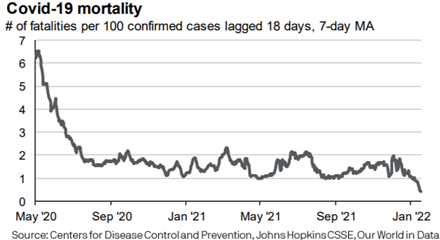
It’s also in-line with recent medical evidence indicating variants may become milder over time.
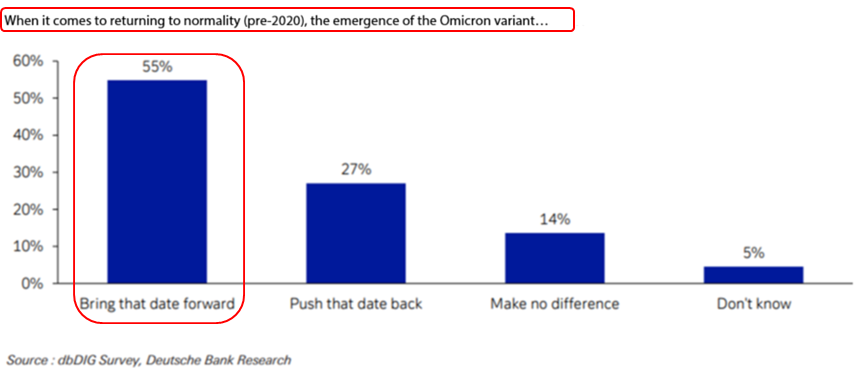
It has also led to some optimism that a silver lining of omicron’s spread and relatively mild symptoms is that we may achieve herd immunity sooner – and in turn – bring forward a return to normality.
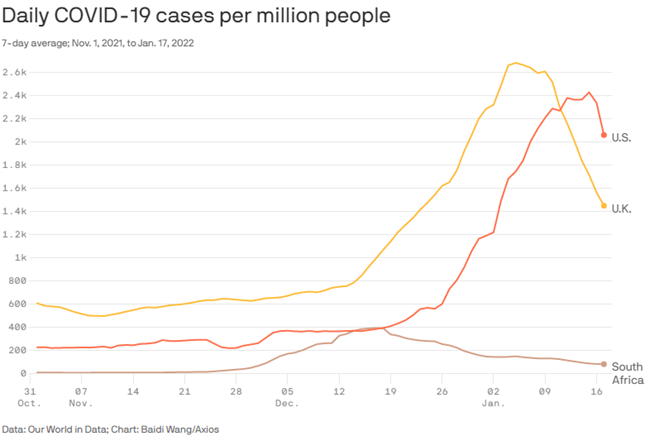
Recent data shows the U.S. may now be past the peak and definite improvement in cases, particularly if we follow the same trend as the U.K and South Africa.
There is also a clear hesitancy by policymakers to impose new restrictions.
And maybe more importantly the economy has largely adapted to the new realities of a COVID world.
Businesses across all sectors of the economy were forced to invest heavily in technology to stay competitive, while consumers have adapted their spending habits. Because of these factors, we anticipate future variants or spikes in cases will have less of an economic impact over time.
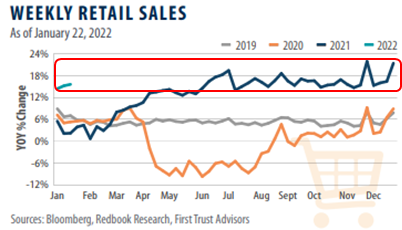
We already had a trend towards online spending before COVID and COVID only accelerated that trend. Consumer’s habits have changed but spending remains strong. Data continues to show strong retail sales despite the effects of omicron. It’s a really important point, as consumer spending makes up about 70% of GDP.
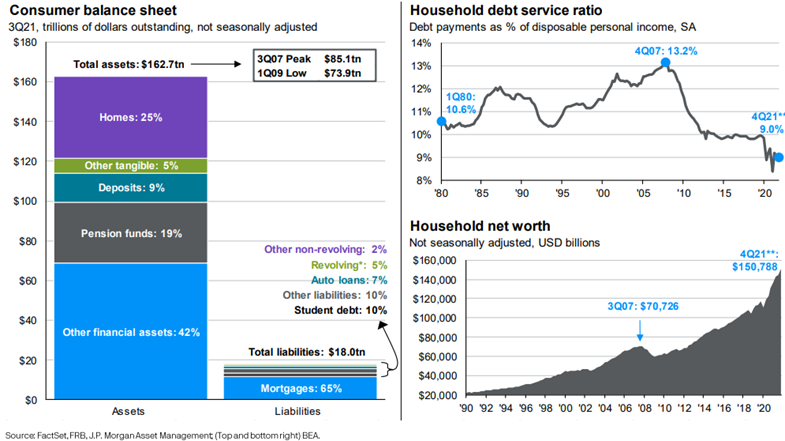
And that spending is supported by an incredibly healthy consumer.
As these charts depict, consumer balance sheets are very strong, household net worth is at all-time highs, while household debt servicing ratios are near all-time lows.
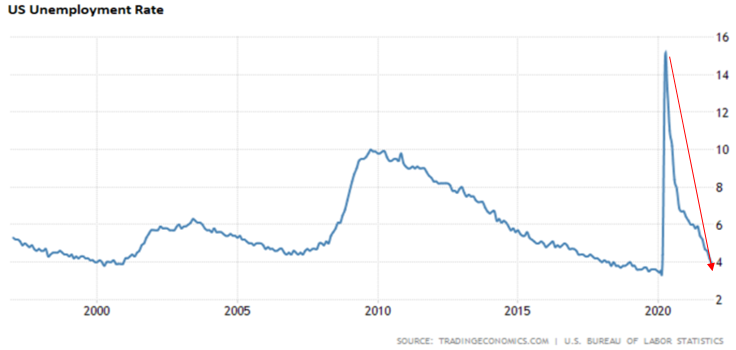
The economy is also supported by a very strong labor market, with the unemployment rate dropping precipitously following the COVID peak.
And we’re seeing an incredibly bounce back in prime age employment relative to prior recessions.
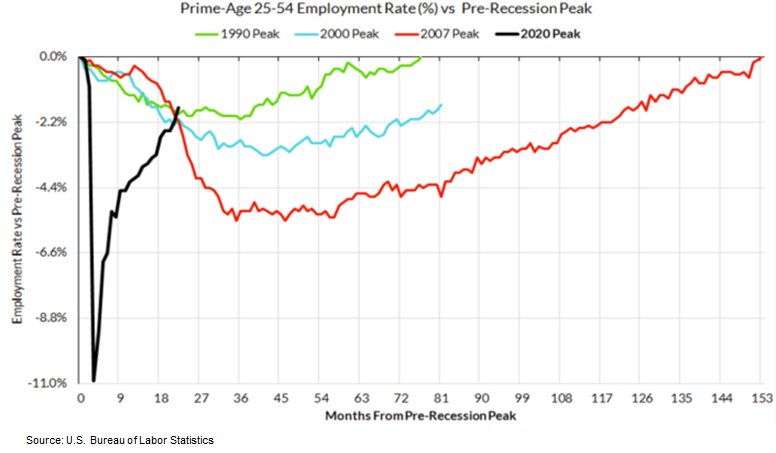
As you can imagine, the Fed is currently far less concerned about their full employment mandate as they are about maintaining inflation around the 2% level.
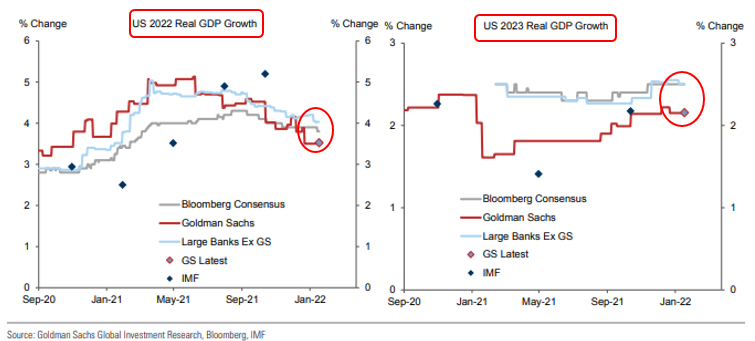
So what does all this mean for growth? We expect above-trend economic growth over the near-term. 2021 full year GDP growth came in at 5.7 percent and 2022 consensus estimates are for growth of just under 4%. Those estimates have come down recently due to omicron. Expectations are for the economy to transition back towards long-term trend growth over time, with consensus estimates of two and a half percent growth in 2023, which is still above the long-term trend growth rate of 2 percent.
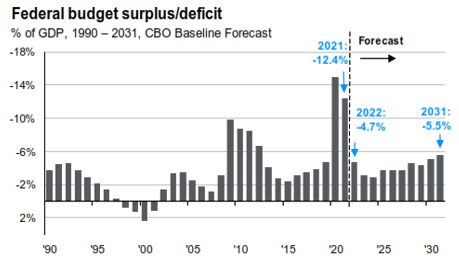
We also anticipate fiscal tailwind to moderate moving forward.
For context, in the 18 months post COVID sell off in March 2020, about 5.3 trillion dollars of stimulus was injected directly into the economy.
Moving forward, the recently passed infrastructure package is about 1.2 trillion dollars and negotiations are still ongoing regarding the Build Back Better package…who knows if something gets done but it’s likely to be a smaller package. Importantly though, these packages will be spent over years. Much of the infrastructure package – for instance – is set to be spent over the course of five years.
One of the common questions that often comes up is about the Federal debt outstanding. As this chart shows, it’s set to be around 100% of GDP for the foreseeable future.
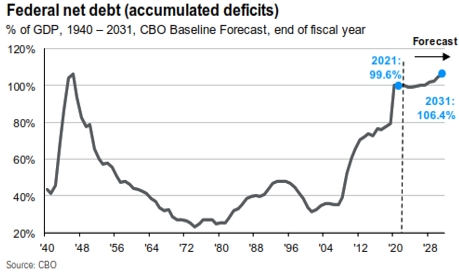
However, we don’t think the absolute level of debt outstanding is the most important metric but the ability of the Government to service that debt that really matters; and the U.S. is in a relatively strong position to service its debt due to low interest rates and above trend economic growth. We don’t believe the level of debt outstanding presents a material risk, even with rising interest rates.
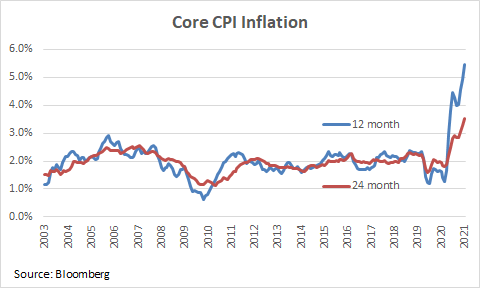
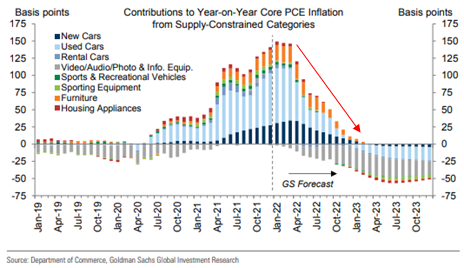
Turning to inflation, Headline CPI posted the strongest increase since 1982, as strong demand on the back of accommodative policies coupled with supply chain constraints led to upward pricing pressure.
We believe inflation may migrate lower in the second half of 2022 as manufacturing bottlenecks eventually ease and virus improvements reduce production disruptions.
Interestingly, if we normalize for the weak base effects of COVID in 2020 and go back 24 months to a pre-COVID timeframe in 2019, core CPI is running at an annualized rate of 3.5%. So yes, elevated, but not the level the headline numbers would suggest.
In terms of the supply chain, there have been some improvements in measures of delivery times recently. While omicron has caused a shortage of workers recently, it appears we are now past the peak, which may help improve supply chain issues.
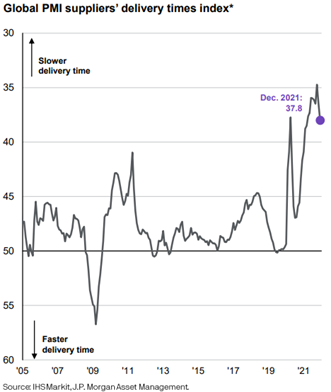
As such, we expect supply chain issues to contribute less to overall inflation, particularly in the back half of 2022.
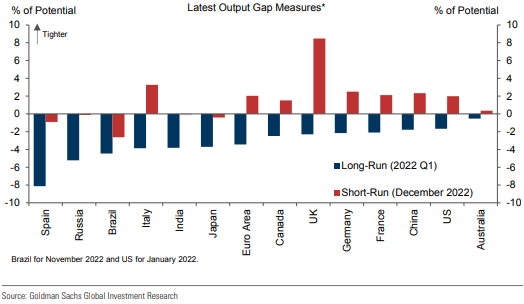
Thinking longer-term, while the red bars in this chart depict that short-term output gaps remain tight due to ongoing supply chain issues, the blue bars indicate that all countries have a significant amount of long-term productivity slack. This may help alleviate inflationary pressures as supply chain disruptions begin to abate.
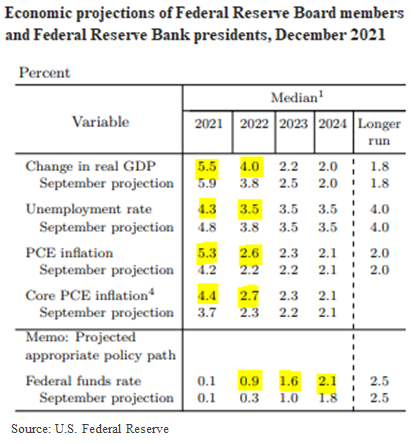
A backdrop of elevated inflation, above trend economic growth and a strong labor market forced the Fed into a more hawkish stance.
The median estimate from the most recent “dot plot” economic projections in December was for three rate increases in 2022 followed by another three in 2023. However, January’s meeting statement indicated four rate hikes are likely. As such, we believe the Fed could hike as early as March, with consensus expectations for an increase of 1% or more in the fed funds rate this year. Clearly, there are Upward risks for rates.
Next, we’ll take a look at our Outlook for financial markets.
Outlook
Two key stock market themes we see unfolding are 1) a moderation in stock market returns from the significant strength witnessed over recent years, and 2) an increase in volatility in-line with historic norms as accommodative policies are taken away. We believe recent stock market dynamics are indicative of this transition.
We are broadly constructive on the outlook for stocks, though tighter policies may moderate returns.
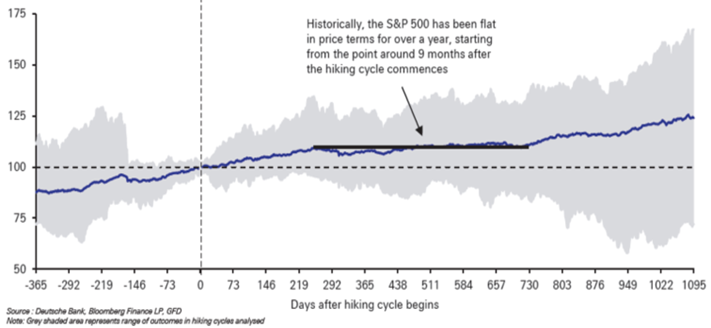
So what are the implications of a Fed hiking cycle on the stock market? Historically, stocks exhibit solid growth ahead of the first Fed hike but to the point of moderating returns, stocks historically plateau nine months after the hiking cycle begins.
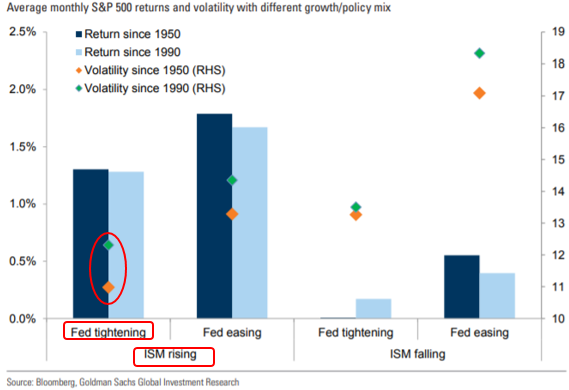
Historically, Fed tightening cycles that are accompanied by accelerating growth tend to be associated with strong returns and relatively low volatility.
Tightening cycles with slowing growth tend to be associated lower, but positive, equity returns and higher volatility.
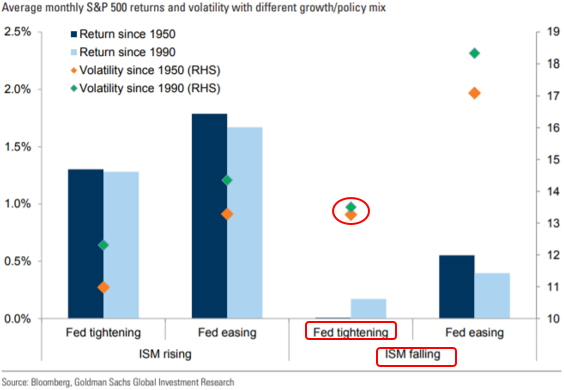
The markets currently appear to be pricing in the latter. However, while broad annual growth is set to moderate, as omicron abates, we may experience a pick-up in growth in the second and third quarters.
In the aftermath of the initial COVID-driven sell off in March 2020, accommodative policies have arguably contained stock market volatility.
Now, with the Fed’s policy pivot, we believe we may return to a more historically “normal” volatility regime.
Market volatility should come as no surprise to long-term stock investors. However, many have become accustomed to the recently low levels of volatility on the back of the Fed’s easy policies.
So what does a “normal” stock market look like? Historically and on average, the stock market experiences a 14.0% intra-year sell-off.
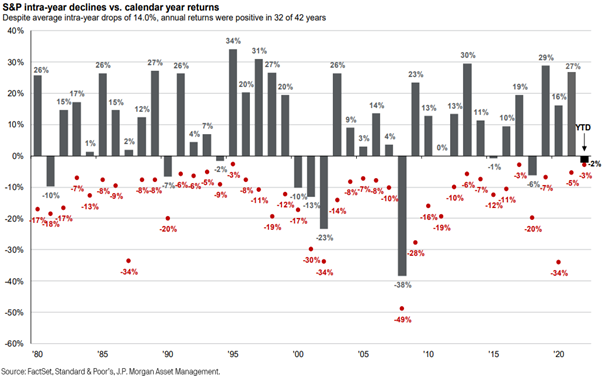
In any given year, you should expect multiple declines of minus 5 percent or more. Importantly – and despite these intra-year sell-offs – stocks more often than not end the year positively, with positive returns in 32 of the last 42 years. An investment in the stock market has historically involved episodes of gains, losses and volatility within an overall upward trend.
Intra-year sell-offs should be expected and may offer enhanced rebalancing opportunities – it may offer our disciplined approach to portfolio rebalancing a greater ability to “buy low and sell high.”
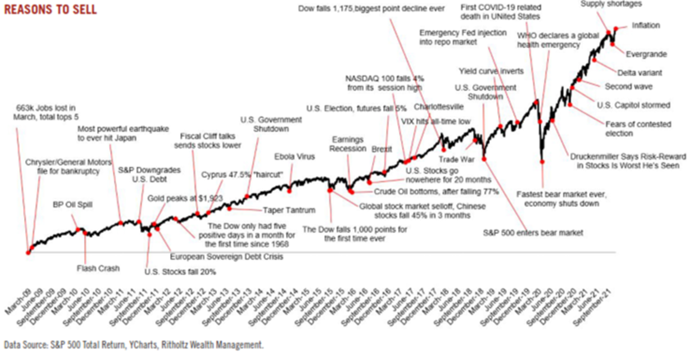
The importance of staying disciplined cannot be overstated. As this chart highlights, in the years following the Great Financial Crisis, there were a number of dire headlines and reasons to sell stocks, or to stay out of the market altogether. However, if you’d listened to that noise, you would have missed out on significant upside returns; staying disciplined, staying fully invested, and not getting sidetracked by short-term noise was rewarded over the long-haul.
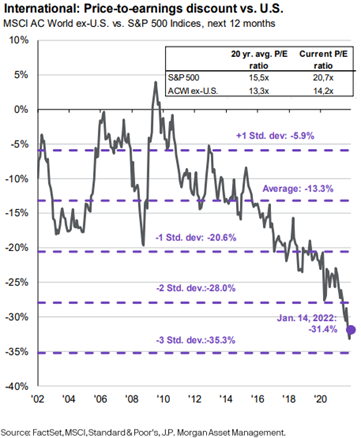
While we anticipate a moderation in stock market returns, international and emerging market stocks may offer upside potential. All our model portfolios have dedicated allocations to both international and emerging markets. This chart highlights that stocks outside the U.S. remain at historically cheap levels, while we believe upside growth potential may be found outside the U.S.
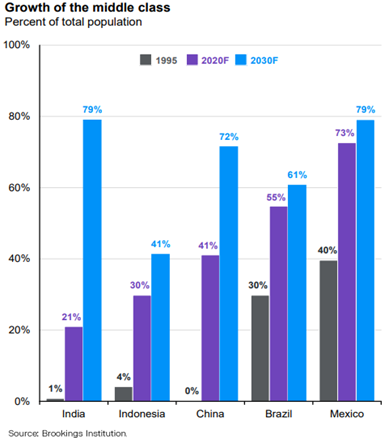
A theme from years past that’s fallen out of the limelight is the concept of growth in the middle class within emerging markets. This continues to be a key driver of growth moving forward. Take China for example. In the 1990’s zero percent of the population was middle class. By 2020 about 40 percent of the population was middle class and that is set to climb to over 70% by the end of this decade. It’s important because these are people who now have money in their pockets who didn’t before. They spend that money and drive economic growth. That internal demand provides for more sustained growth. Higher economic growth in turn should lead to higher earnings growth in the stocks of companies operating in those same countries and lead to the potential for outsized returns.
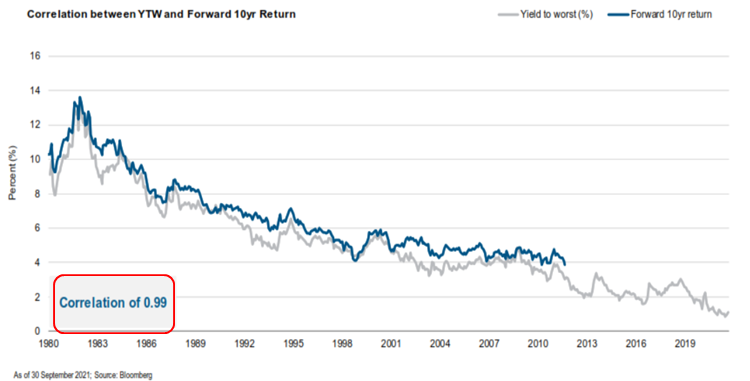
Turning to bonds, this is a nice, simple chart that speaks volumes. The primary driver of forward looking 10-year returns is the current yield on those bonds. Due to the low – albeit rising – interest rate environment, we believe traditional core fixed income – think 10-year Treasury bonds – will be challenged moving forward.
Given the outlook and interest rate forecasts, there is clearly upward risks for rates, which is highlighted by estimates for the ten-year Treasury yield, with average expectations of 2% by end of year.
What’s very clear here is the significant dispersion in expectations, indicative of the recent volatility in the rates market we discussed earlier.
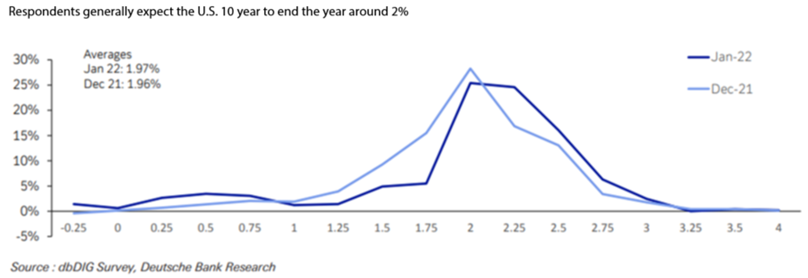
While our base case is for upward pressure on interest rates, one concern is everyone anticipates the same thing, and when everyone anticipates one thing, another often happens.
There may actually be upward limits to how far yields could rise. Take last year as an example. The broad bond market was down nearly 2% yet over $200 billion flowed into fixed income ETFs in 2021. And that’s with the Fed telling the market they’re likely to raise rates at least three times!
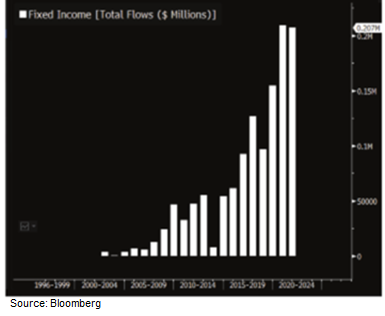
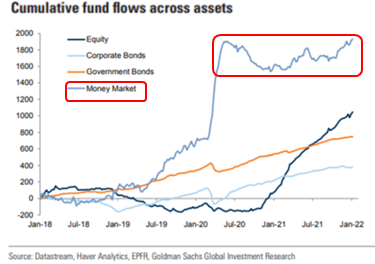
The reason? There’s a record amount of money trying to find a home. Look at the amount of cash yielding nothing. Some of it has flowed into the stock market and may continue to help underpin stocks, but there may be natural upward caps on how far rates can rise. Even at 2 percent, it’s a lot better than what cash is yielding.
Now also consider foreign investors whose domestic bond yields may be lower – or in some cases negative. If U.S. rates rise, they become increasingly attractive to those foreign investors, which may act as a natural upper cap to how far yields are able to rise.
With that being said, we do believe interest rates are likely to move higher. As such, we believe longer dated bonds – think Treasuries with maturities of 10 years or more – may be particularly susceptible and are actively positioning our fixed income allocations away from those securities.
However, we do believe core, high quality fixed income plays an important role within well-diversified portfolios for two key reasons.
Firstly – and this is most often cited – it is the single best portfolio diversifier when markets sell-off 20% or more. In these environments bonds have historically held their value or appreciated, offering downside protection and insurance. They really do help anchor the portfolio.
The second reason, and very much related but not often focused on – is that it provides for enhanced rebalancing opportunities. For instance, when a 60-40 portfolio moves to a 50-50 because stocks have fallen, core fixed income allows you the opportunity to buy those stocks cheap by selling fixed income on strength – again buying low and selling high. That added benefit can add considerable value over the long haul.
Elsewhere, we believe attractive risk-adjusted return opportunities exist in less liquid income-oriented strategies, which may offer equity-like return potential with lower volatility and the potential to benefit from a rising interest rate environment.
At a high level, we continue to favor stocks over bonds.
We hold a positive long-term outlook for the stock market and believe any increase in market fluctuations may offer an opportunity, allowing us to more effectively rebalance across our client accounts.
Given the macro-economic backdrop, we believe our direct investment strategies are well positioned to continue to generate attractive yield, low correlation to the stock market, and low levels of interest rate risk.
Overall, we continue to focus on long-term fundamentals and believe our portfolios are well positioned to continue to meet the financial goals of our clients. For more information, please visit missionwealth.com or contact your advisor.
Disclaimers
The information in this presentation is subject to change without notification. Certain statements contained within are forward-looking statements, including, but not limited to, statements that are predictions of or indicate future events, trends, plans, or objectives. Undue reliance should not be placed on such statements because, by their nature, they are subject to known and unknown risks and uncertainties. Although the opinions expressed are based upon assumptions believed to be reliable, there is no guarantee they will come to pass. This information may change at any time due to market or other conditions.
International investing entails special risk considerations, including currency fluctuations, lower liquidity, economic and political risks, and differences in accounting methods. Diversification cannot ensure a profit or protect against a loss.
Investments in commodities may be affected by the overall market movements, changes in interest rates and other factors such as weather, disease, embargoes and international economic and political developments. Commodities are volatile investments and should form only a small part of a diversified portfolio. The use of derivative instruments may add additional risk. An investment in commodities may not be suitable for all investors.
Diversification helps you spread risk throughout your portfolio, so investments that do poorly may be balanced by others that do relatively better. Neither diversification nor rebalancing can ensure a profit or protect against a loss.
Real estate may not be appropriate for all investors. Its value may fluctuate based on economic, regulatory, and environmental factors. Redemption may be at a price, which is more or less than the original price paid.
Do not act upon this information solely, and seek professional guidance before making investment decisions. This presentation is not intended to provide any specific investment advice. No investment strategy can ensure a profit.
Fixed income securities carry interest rate risk, inflation risk and credit and default risks. Any fixed income security sold or redeemed prior to maturity may be subject to a substantial gain or loss. Interest income generated by municipal bonds is generally expected to be free from federal income taxes and, if the bonds are held by an investor resident in the state of issuance, state and local income taxes. Such interest income may be subject to federal and/or state alternative minimum taxes. Investing in municipal bonds for the purpose of generating tax-exempt income may not be appropriate for investors in all tax brackets. Short- and long-term capital gains and gains characterized as market discount recognized when bonds are sold or mature are generally taxable at both the state and federal level. Short- and long-term losses recognized when bonds are sold or mature may generally offset capital gains and/or ordinary income at both the state and federal level.
Fixed income yields are provided by Barclay’s Capital based on the following sources: US Treasury, Barclay’s Capital, FactSet, and JP Morgan Asset Management, and are represented by Brad Market, US Barclay's Capital Index, MBS, Fixed Rate MBS Index, Corporate, US Corporates, Municipals, Muni Bond Index, Emerging Debt, Emerging Markets Index, High Yield, Corporate High Yield Index. Treasury securities date for # of issues and market value based on US Treasury benchmarks from Barclay’s Capital. Yield and return information based on Bellwethers for Treasury securities.
Mission Wealth is a Registered Investment Adviser. This document is solely for informational purposes. Advisory services are only offered to clients or prospective clients where Mission Wealth and its representatives are properly licensed or exempt from licensure. Past performance is no guarantee of future returns. Investing involves risk and possible loss of principal capital. No advice may be rendered by Mission Wealth unless a client service agreement is in place. California Insurance License # 0D35068.
00439075 02/22