



When people invest in a company, whether through stocks, bonds, or loans (debt), they’re participating in what’s known as the capital stack. This determines where the investor stands regarding who gets paid first, who bears the most risk, and how likely each layer is to suffer losses, especially during downturns or defaults.
Understanding the capital stack is critical because not all debt and equity investments carry the same level of protection or risk exposure.
The capital stack is the hierarchy of a company’s obligations to investors:
Contractual Repayment Rights:
No Repayment Rights:
5. Common Equity (most risk)
As you move down the stack, risk generally increases, and the likelihood of loss rises, but potential return may also increase.
Historical context:
Even when companies default, senior lenders often recover a meaningful portion of their capital. In many cases, if senior lenders are not made whole, investors below them in the stack may lose their entire investment.
What this means for investors:
Investors sometimes refer to shifting from equities to senior debt as “moving up the capital stack” to reduce risk exposure.
Another way to evaluate risk is by comparing income spreads. For example, if U.S. Treasuries yield 3.5% and another debt investment yields 8%, the investor earns an additional 4.5% to compensate for risk. That extra yield can absorb some level of defaults before the investment underperforms safer alternatives. Historically, default rates for senior secured loans have been well below that spread, especially after factoring in recovery rates.
The chart below shows that high-yield bonds are widely accepted as a core staple of diversified portfolios, yet their default rates have historically been higher than those of senior direct lending and leveraged loans.
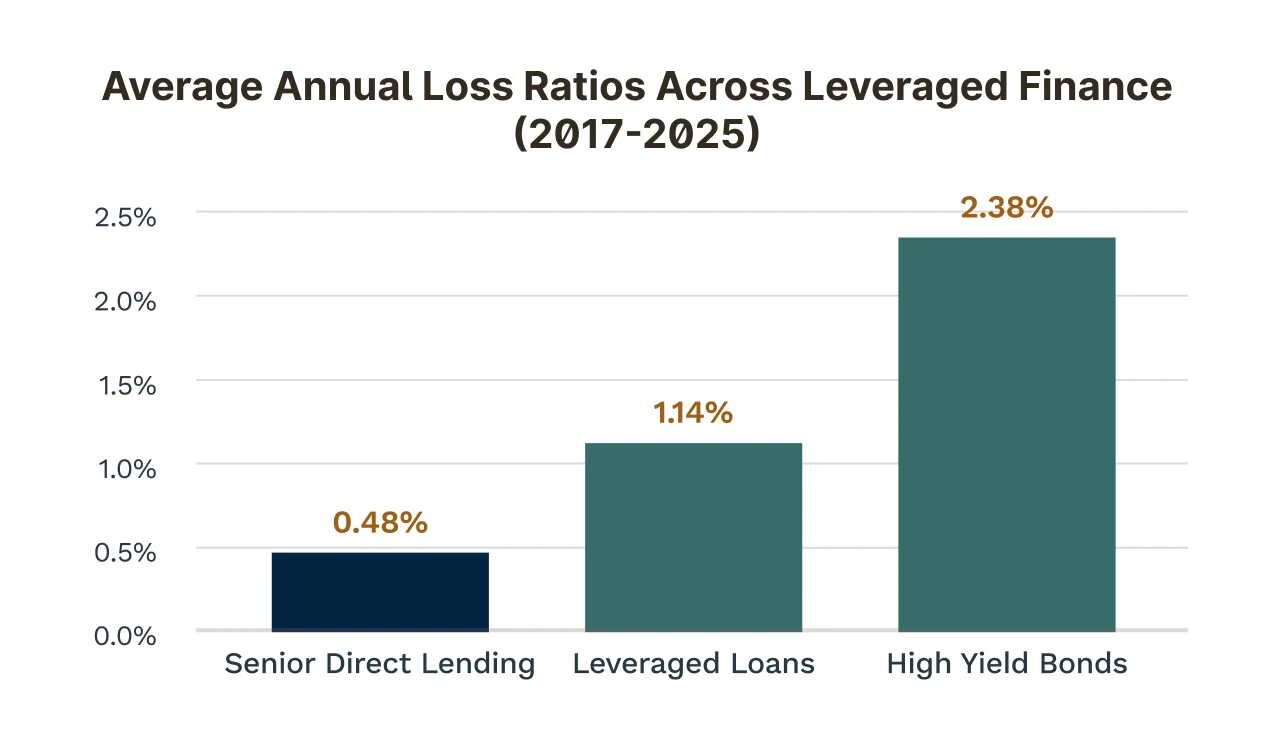
Source: PitchBook LCD, Cliffwater, Moody’s, S&P Global, Morgan Stanley Investment Management. Leveraged loan and high yield loss rates are calculated from annualized data between 2017 and 2025 and use the following formula: LTM default rate * (1 minus – average recovery rate). Default rates for leveraged loans are based on PitchBook LCD data and include distressed exchanges. Recovery rates for leveraged loans are based on S&P Credit Pro data. Default and recovery rates for high yield bonds are based on Moody’s data and include distressed exchanges. Credit losses for senior direct lending are based on annualized data between 2017 and 2025 from the Cliffwater Direct Lending Index – Senior (CDLI-S) using reported net losses (realized) adjusted for estimated imbedded gains. The broader Cliffwater Direct Lending Index (CDLI), which is representative of both senior and non-senior loans originated for middle market borrowers, would produce an estimated annualized loss of 1.47%.
Default reality:
Default reality:
Positions 1-3 become equity owners upon default.
Default reality:
What this means for investors:
Default reality:
What this means for investors:
Default risk is not evenly distributed—it increases meaningfully as you move down the capital stack.
Higher in the stack = greater protection, lower volatility
Lower in the stack = higher growth potential, greater loss exposure
While no investment is risk-free, understanding where an investment sits in the capital structure can help investors make more informed, strategic decisions.
A well-constructed portfolio often includes exposure across multiple layers of the capital stack, balancing income, growth, and risk management.
The historical data below help illustrate how position in the capital stack can influence outcomes during periods of market stress. As shown in the chart, investments higher in the capital structure, such as senior direct lending, have historically demonstrated more resilient performance during market dislocations compared to lower-ranking debt and equity investments.
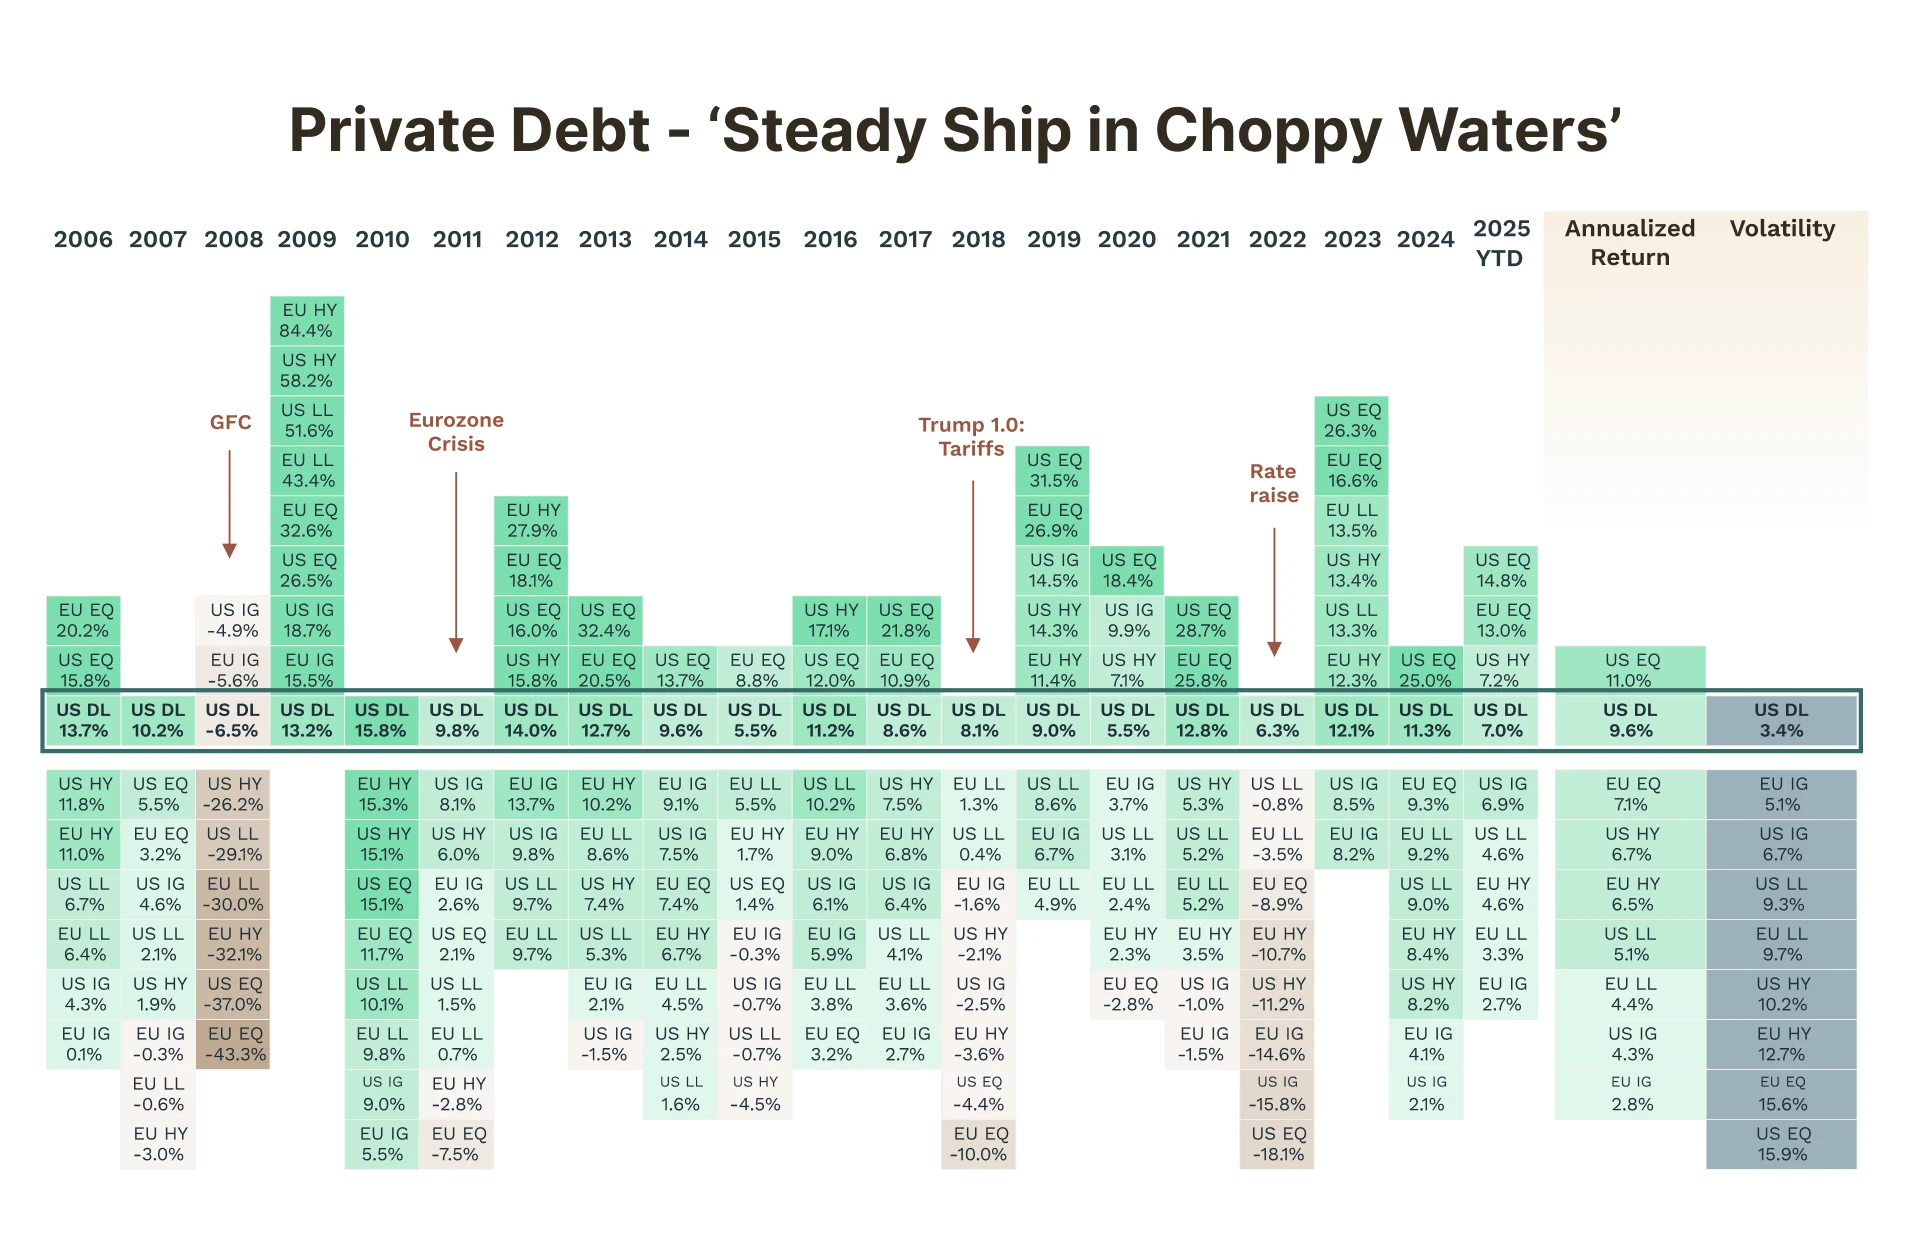
Sources: Bloomberg and Cliffwater. For illustrative purposes only. The chart shows annual index total returns in USD for the following indices: US DL – Cliffwater Direct Lending Index, US EQ – S&P 500, EU EQ – MSCI Europe Index, US HY – Bloomberg US High Yield Index, EU HY – Bloomberg Pan-European High Yield Index, US IG – Bloomberg US Corporate Index, EU IG – Bloomberg Pan-European Corporate Index, US LL – Morningstar LCD US Leveraged Loan Index, EU LL – Morningstar LCD EU Leveraged Loan Index. Based on data until September 30, 2025.
1. Why is senior debt considered safer than equity?
Senior debt holders are paid first and often have claims on company assets, leading to higher recovery rates in default scenarios.
2. What happens to equity investors during bankruptcy?
In most cases, equity investors are last in line and may lose their entire investment if the company cannot meet its obligations.
3. Should investors avoid lower positions in the capital stack?
Not necessarily. Lower-risk positions, such as equities, can offer higher long-term returns, but they should be balanced within a diversified portfolio aligned with risk tolerance.
Mission Wealth is a Registered Investment Adviser. This commentary reflects the personal opinions, viewpoints, and analyses of the Mission Wealth employees providing such comments. It should not be regarded as a description of advisory services provided by Mission Wealth or performance returns of any Mission Wealth client. The views reflected in the commentary are subject to change at any time without notice. Nothing in this commentary constitutes investment advice, performance data, or any recommendation that any particular security, portfolio of securities, transaction, or investment strategy is suitable for any specific person. Any mention of a particular security and related performance data is not a recommendation to buy or sell that security. Mission Wealth manages its clients’ accounts using a variety of investment techniques and strategies, which are not necessarily discussed in the commentary. Investments in securities involve the risk of loss. Past performance is no guarantee of future results.
KEY TAKEAWAYS
The capital stack determines who gets paid first in an investment. Investors higher in the stack (like senior debt) typically face lower risk and higher recovery rates, while those lower in the stack (like equity) take on more risk but have greater upside potential.
Schedule a complimentary 30-minute discovery call to discuss your unique situation and financial goals.

"*" indicates required fields
By providing a telephone number and submitting the form, you are consenting to be contacted by SMS text message and agreeing to our privacy policy and disclaimers. Message frequency may vary. Message and data rates may apply. Reply STOP to opt out of further messaging. Reply HELP for more information.

Client Development Advisor
or call us: 805-902-4550
"*" indicates required fields
Schedule a complimentary 30-minute discovery call to discuss your unique situation and financial goals.
Prefer a phone call? Call us: 805-902-4550
By providing a telephone number and submitting the form, you are consenting to be contacted by SMS text message and agreeing to our privacy policy and disclaimers. Message frequency may vary. Message and data rates may apply. Reply STOP to opt out of further messaging. Reply HELP for more information.
For general inquiries: click here.